Spatial Humanities
For the next two weeks we will be exploring the spatial humanities — a vibrant and increasingly popular area of digital humanities research. Humanities scholarship is currently undergoing a “spatial turn” akin to the quantitative, linguistic and cultural “turns” of previous decades, and many are arguing that the widespread adoption of Geographic Information Systems (GIS) technology and user-friendly neogeography tools are fundamentally reshaping the practice of history and other disciplines. Yet while these powerful computer tools are certainly new, the mode of thinking “spatially” is not unprecedented, and may in fact be seen as a move away from the universalizing tendencies of modern western scholarship towards more traditional understandings of the lived experience of place, emphasizing the importance of the local context.
In practice, much of this scholarship involves creating maps — an act that is not without controversy. Maps are conventional representations of space that come laden with the embedded cultural worldviews of their makers. Maps are also highly simplified documents that often paper over contested or fuzzy boundaries with firm lines; it is hard to express ambiguity with maps, but it is very easy to lie with them.
The familiarity of widespread tools like Google Maps and Google Earth might fool us into thinking these are unproblematic representations of space, but it must be remembered that all maps contain embedded assumptions and cannot be taken at face value. Maps produced in the course of humanities scholarship are not just illustrations but arguments, and they must be read with the same level of critical analysis that you would apply to articles or monographs.
(For more concrete suggestions along these lines, see Humanizing Maps: An Interview with Johanna Drucker.)
Example 1
One area of historical research that saw an early adoption of GIS is economic land use. A good example is Michael McCormick’s book on the Origins of the European Economy, which layered many different types of evidence against each other in a GIS to argue for a much earlier origin to Europe’s medieval economy than had been accepted previously. McCormick has since made his database publicly available and continues to add to it with collaborators at Harvard, as the Digital Atlas of Roman and Medieval Civilization.
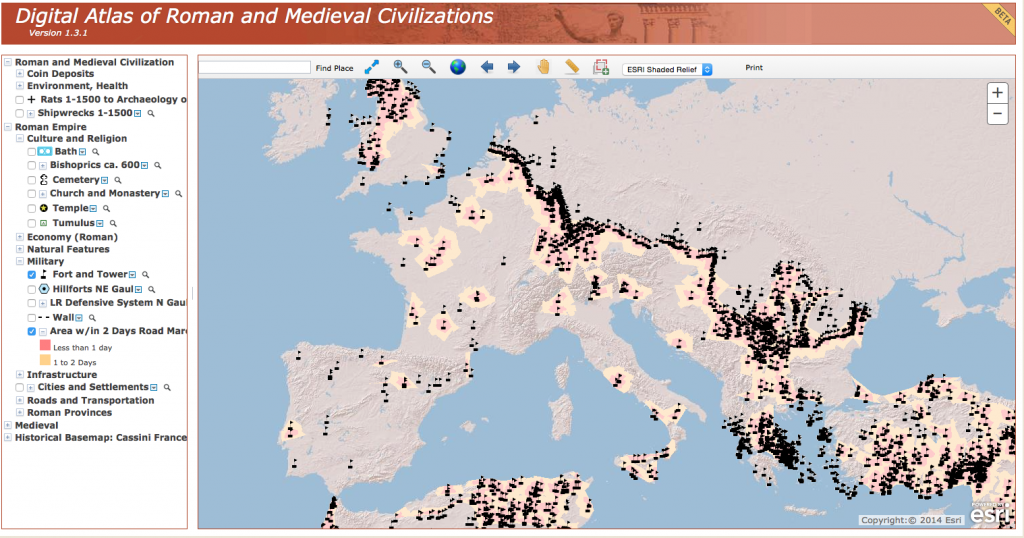
The DARMC provides a rich resource and a good introduction to the potential of GIS to reveal patterns and connections through the spatial layering of disparate datasets. It also offers a good orientation to the basic layout of most GIS systems, with a map view window on the right and a list of layers on the left that can be turned on and off.
Explore the DARMC.
- What layers have been included?
- What patterns show up when you juxtapose cultural, environmental and economic data in this way?
- What connections do you see?
- The developers recently made the decision to separate the layers into four distinct maps (compare the list at right with the image of the old version above).
- What potential patterns might be lost as a result of this decision?
- Are there any problems you foresee with the arguments this decision makes?
- Also take the opportunity to explore the measurement tools at the top of the window to interrogate the spatial attributes of the data.
Example 2
The quantitative data compiled in projects like the DARMC can help address many historical problems, but they don’t necessarily answer more qualitative research questions concerned with the lived experience of the past. For this objective, we must move beyond birds-eye-view 2D maps of spatial distributions and attempt to visualize particular places at particular moments in time. Such “geovisualization” — the digital reconstruction of past landscapes — is another booming area of scholarship that allows us to virtually experience a place as it might have been, and also has the potential to answer important scholarly questions.
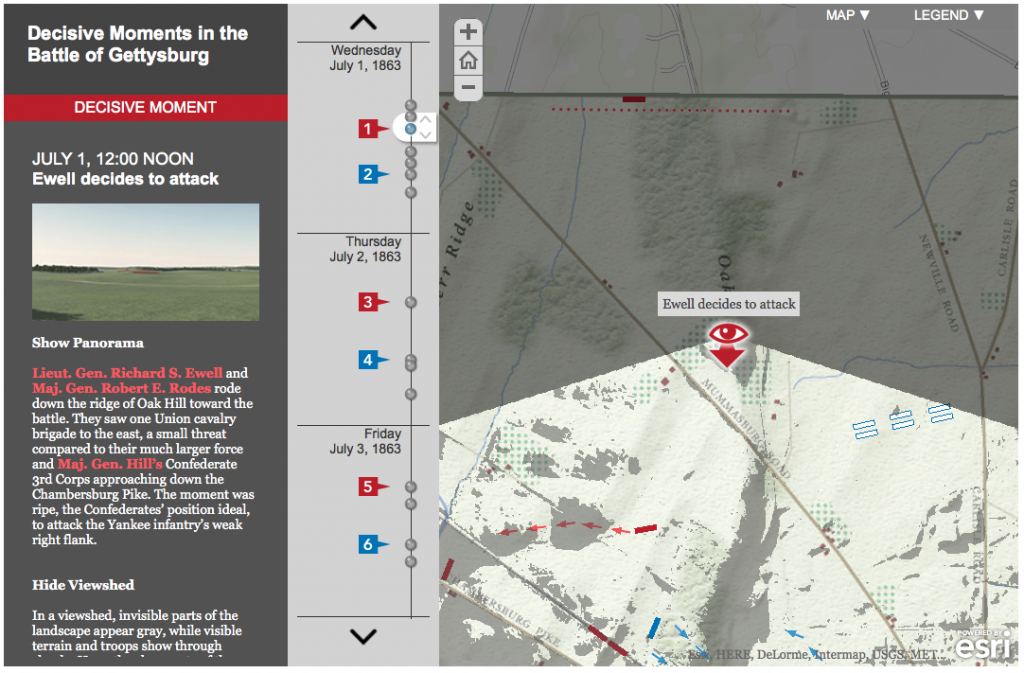
Anne Kelly Knowles’ digital reconstruction of the Battle of Gettysburg is an excellent example of this potential that uses a combination of digitized information from historical maps, documentary accounts and environmental data on the physical geography of the battlefield to answer the question of what the generals could see during the battle and how those sightlines influenced their decision making.
- Read the brief introductory article at Smithsonian magazine and then explore the “story map” in detail.
- How does the map combine geographic and temporal information?
- Does it effectively give you a sense of the experience of being on the battlefield?
- What does this reconstruction offer that more traditional publications could not?
- What could be improved in the representation?
Group Exercise: The Varieties of Maps
(Exercise borrowed from Lincoln Mullen)
The next step is to become familiar with as wide a variety of maps as possible, including digital maps and analog, maps that have been made by scholars and maps that have not. Below is a list of online mapping projects.
In a group, pick three projects from the list to explore and compare. Your aim is to gain familiarity with projects involving maps and mapmaking, both by scholars and on the web generally.
- American Migrations to 1880
- Atlantic Networks Project
- Atlas of the Historical Geography of the United States
- Counties Blue and Red, Moving Right and Left
- Digital Harlem
- Digital Harrisburg
- Flowing Data: Coffee, Pizza, Burgers
- Geography of the Post
- Going to the Show
- Hestia: Home for Geospatial Analysis of Herodotus’s Histories
- Hidden Florence
- Histories of the National Mall
- History Pin
- Holocaust Geographies Collective
- How Your Hometown Affects Your Chances of Marriage
- Hypercities
- Locating London’s Past
- A Map of Baseball Nation, Baseball’s Second-Place Favorites: Go, Mets
- Mapping the Republic of Letters
- Mapping the State of the Union
- Mapping Texts
- Map of Early Modern London
- Mapping Gothic France
- Mapping the Medieval Townscape
- Mapping Poverty in America
- Midterm Elections
- Murder Map
- NYPL Map Warper
- Orbis
- PhilaPlace
- Pelagoios
- Pleiades
- Stop and Frisk is All But Gone from New York
- Railroads and the Making of Modern America
- Ben Schmidt, Mapping ship logs
- Spread of U.S. Slavery, 1790–1860
- Stanford Spatial History Project
- Travelers in the Middle East Archive
- Visualizing Emancipation
As you look through these projects, consider the following questions or prompts.
- What categories do these maps fit into? Start to envision a taxonomy of maps by considering the purposes of the maps, their audience, and their interfaces, among other axes of comparison.
- What is the grammar of mapping? In other words, what are the typical symbols that mapmakers use, and how can they be put in relation to one another?
- Which maps stood out to you as especially good or clear? Why?
- Which maps were the worst? What made them bad?
- How do scholarly maps differ from non-scholarly maps?
- What kind of data is amenable to mapping? What kinds of topics
- What accompanies maps? Who controls their interpretation? What is their role in making an argument?
- How do recent web maps compare to maps made online in the past few years? Are any of them broken? How can maps be made sustainable?
- Which of these maps are in your discipline? Which maps might be helpful models for your discipline?
Exercise (Georeferencing)
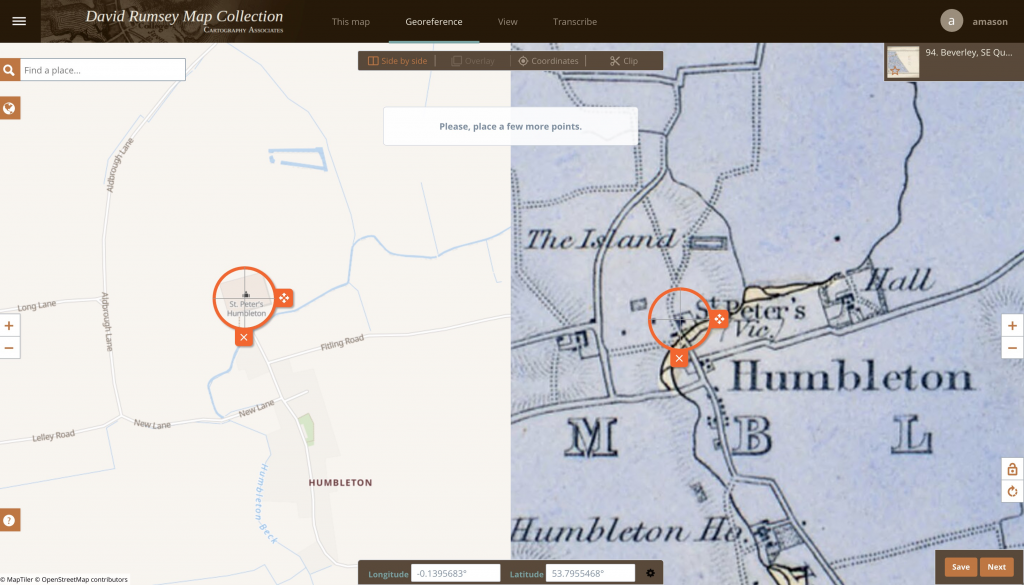
In order to reconstruct past landscapes like the Gettysburg battlefield, the first step is often digitizing the data recorded in a historic map by georeferencing (or to be more precise georectifying) that image — that is, aligning the historical map or image with its location on the earth in a known coordinate system. There are many ways to do this, and traditional desktop GIS software is still often the most precise, but we will start with a cloud based solution requiring no complex software.
The David Rumsey Map Collection is a vast archive of scanned historic maps, mostly covering North and South America. They have enabled a crowd sourcing technique to get the public to help georeference these images for use in GIS applications. The previous version was very buggy and not very accurate, but they have made improvements recently in version 4.
Georectify a historic map
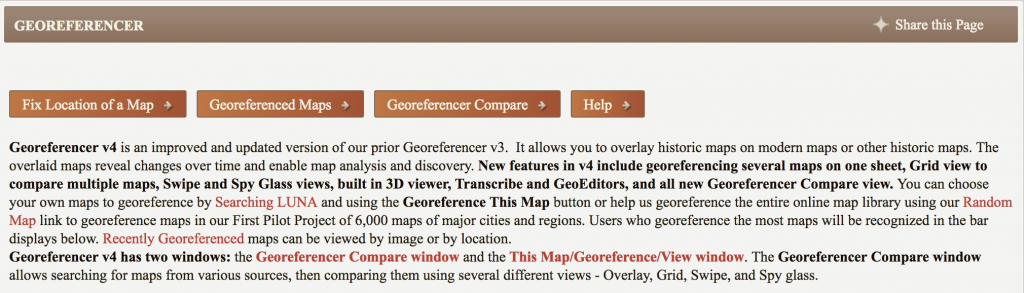
- Go to the David Rumsey Georeferencer page
- Use the “Fix Location of a Map” button to find a random map to georectify
- You can use the Next button in the bottom right to page through some more options if you don’t like the first
- NB: You may need to sign up for a free account if you don’t accept the first couple they offer you
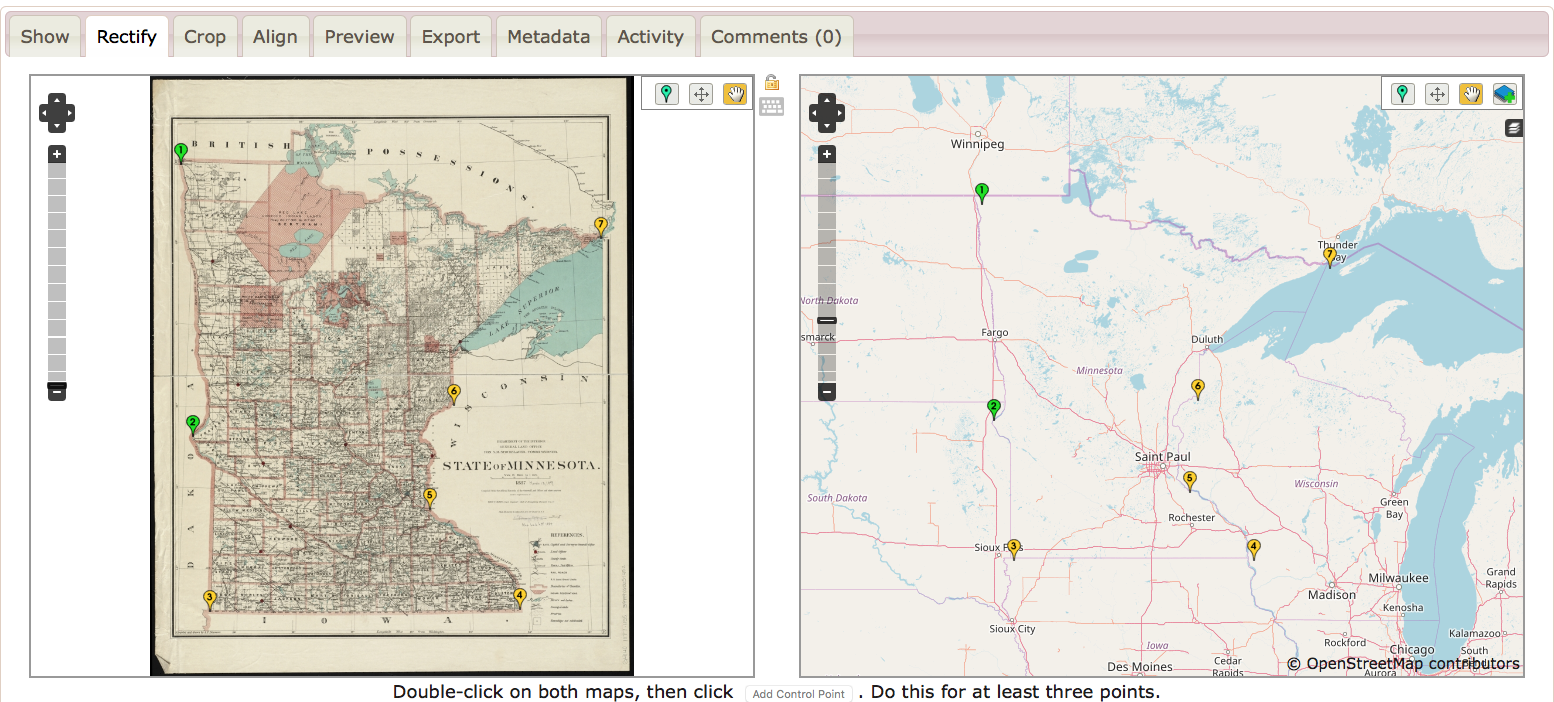
- Once you’ve found a map that interests you, use their tools to
- Search, pan and zoom to find locations in the image
- Set control points (at least 5 are recommended) by identifying the same place on the image and a modern map
- Clip the map area
- Save to rectify the map
- When you are finished, you will see the map overlaid on a basemap of the world and can compare your work to other historic maps of the same place
If you need additional instruction, there are detailed steps on the Georeferencer HELP page
Assignment
- When you are finished, get the sharing link and post your thoughts on the process along with the link to your work in a COMMENT ON THIS PAGE.
- Did this process change your understanding of the spatial DH projects you explored earlier?
- Begin to think about your Final Project and what it might entail.
- What sources in the Carleton Archives (or elsewhere) are you interested in exploring?
- What methods that we have explored so far are you interested in trying out?
- Text Analysis?
- Network Analysis?
- Spatial Analysis?
- 3D Modeling?
- Digitization?
- Digital Storytelling?
- Something else?
- What other students might you be interested in working with?
Resources
Lincoln Mullen of the Center for New Media and History at George Mason University has developed a fantastic resource for getting started with mapping for the humanities.
The Spatial Humanties Workshop site he developed will give you a detailed introduction to the different types of maps you might want to make as a digital humanist, the software and libraries that are out there to use, and most importantly the academic issues and theoretical questions that are raised by mapping humanities data in a digital space.
NB: Another great tool for online rectifying is MapWarper, which lets you upload your own maps and align them to modern geography.
For an alternate tool, follow these instructions from Lincoln Mullen to Georectify a map with MapWarper
Here is my map. The process of making it was actually pretty fun — even though the map was of the entire world, and therefore not that difficult to place, I felt like I was contributing to something. It definitely changed my perspective on the DH projects we looked at — it gave me a better appreciation for the human work required to match hand-drawn and digitized maps.
The process of helping superimpose a drawn map onto a similar, to-scale digital representation of the actual geographic area was really fun and interesting to participate in, in my opinion. It really helped me understand the process of digitalization on a more practical, day-by-day level, and ultimately how much work is required to make a field like the digital humanities even possible.
A link to my map can be found here: https://davidrumsey.georeferencer.com/maps/cb4378cd-2d7a-5b04-8f5e-0d5dff36fb58/view
This was the map that I worked on: https://davidrumsey.georeferencer.com/maps/c6c9f06d-111d-5e95-b213-e873e93cb4f7/
I chose this sixteenth-century map of Orvieto, Italy because I had taken a seminar on medieval Italian history and I was excited to put my knowledge to the test. My insight into medieval Italian cities actually proved helpful since many of the names were in Italian and I was able to infer what they were based on my prior knowledge. There were two things that made this map difficult: 1) it was a view of a city’s skyline, not a map of the city, so the overlay doesn’t really work and 2) the small scale of the map made it really difficult to identify landmarks. I tried searching for “Santa Maria” or “Saint Augustine” but they didn’t appear and I ended up having to open a new tab and locate the churches on Google Maps to help me georectify the map. Even though the overlay doesn’t work exactly, I still think georectifying the map is useful to scholars since it shows how medieval Italians imagined their cities in spatial terms and how that compares to contemporary realities.
Making this href=”https://davidrumsey.georeferencer.com/compare#183822894853″>map was a very interesting and fun way to interact with a DH project. I think the most revealing part about this assignment for me was just how effective crowdsourcing can be as a means to create projects; not only does it allow for projects to be larger in scale, but it also allows people to both interact with and contribute to a project. Having done just one map, it still feels interactive and fun to be able to point to it with the link and show my contribution. I think striving for interactivity in DH and data visualization projects is really important, and this one does a great job of it.
That didn’t work so well huh…
https://davidrumsey.georeferencer.com/compare#183822894853
Here’s the map I worked on. It’s a figurative map of the net kilometric products from a given city’s railways from 1892. It was pretty fun, but it was also a little frustrating. The search tab was very helpful! Even after adding many points, the coastline of the older map wouldn’t line up with the modern-day one. Still, I could definitely see how this is could be a way of making old maps more useful.
This process changed my understanding of spatial humanities. I noticed that when I am mapping, I am trying to find similar geographic features/landmarks between OpenStreetMap and the original version. On the other hand, when the maps are matched and stacked on top of each other, I focus more on the differences in geographic representation rather than the commonalities. The change in thought process and perspective is very interesting. Here is a link to my work: https://davidrumsey.georeferencer.com/compare#306705968342
Here’s the map that I worked on. https://davidrumsey.georeferencer.com/maps/2d084e8f-202e-5f8b-adb8-be650b391ef9/georeference I really enjoyed this exercise! I had briefly heard about spatial analysis before today’s class/readings, but I didn’t really know what it was or what it entailed. But after today, I have a much better understanding of not only what it is, but also what the process of digitizing maps is like. Although the process of trying to find and match up geographic landmarks was tedious, I really enjoyed how you could immediately check your work and see if the places line up with the overlay tab. One thing that stood out to me was the difference in the location of the small islands between the two maps. It was difficult to find islands that were identical in both so I found myself looking more at the coastline of the mainland.
https://davidrumsey.georeferencer.com/compare#429589041831
I thought this was really fun when it was a part of the world I was familiar with, but it got a lot harder when I was looking at names of places that meant nothing to me. I imagine that actual georeferencing could be done more efficiently by those with better knowledge of the subject and what events have changed the geography of the areas.
This was a wonderful experience. After going through multiple different maps which I couldn’t recognize as they were in a different language, I landed on a map from the year 1855 showing Delaware and Maryland. I had a hard time trying to find easy spots that occur on both maps, as some spots on the 1855 map do not exist anymore. This exercise made me appreciate all the work that is put into making maps, as it takes a lot of manpower. I also started to understand how the maps we saw were made, with data being taken from many places (and languages) and assembled into an explanatory map.
My map: https://davidrumsey.georeferencer.com/maps/42c7cc4d-5eb5-5a3b-9d31-659b219c5081/view
This assignment was so fun. It was really cool to see a super old map compared to an updated one. I did a couple of these and one of them regarded a map of the Scandinavian countries. The old map had more land masses that didn’t exist in the newer one. This may have been to old technology or potentially water levels rising. The map I ended up sticking with was one of ancient China. I don’t know what year it was, but the country was much smaller than what it is currently. The old China hadn’t gotten much of the land in the west and didn’t have ownership of the land above the Koreas. This was really interesting. I wondered how and who could make a map like this such a long time ago. Here’s the link: https://davidrumsey.georeferencer.com/compare#552472115320
I definitely understand more about spatial digital humanities. I’m getting a better understanding of how websites could make ancient maps interactive. It’s all really new to me and really cool.
This was the map that I Georectify: https://davidrumsey.georeferencer.com/compare#675355188809. It was effortless, quite fun, and satisfying to work on this map. The software is intuitive and works really well. It was wonderful to see how well the two maps overlay. After I marked three points, I also liked how it started adding points automatically, which were mostly correct – it made the work easier. I am beginning to appreciate much more the spatial digital humanities.
This was fun! I clicked through some different maps and settled on a map of Illinois because I could actually recognize it. This process really helped me see the cool uses for DH projects. It’s really nifty to be able to see an old map superimposed on a more standard new map and even cooler to be able to adjust the transparency! I think the spatial DH projects I explored earlier could also really benefit from such mapping tools. It’s really convenient to have multiple maps all in one place and be able to see how they fall on top of each other. And overlaying maps could also help declutter some of the maps I saw (like the burger map) and make it easier for the user to view information.
I really enjoyed doing this exercise! I was amazed by all the different styles of maps and how many of them they were able to put on this website. It took me a little bit to understand the software and multiple times, I ended up clicking “Next” thinking it would automatically take me to the overlay function. Instead, I ended up having to start over with an entirely different map! I ended up using a map of North Carolina, which was interesting because I don’t know a lot about the state, and pretty straightforward, because there was text on the map that helped guide me. My favorite thing about this project is how interactive and ongoing it is. Most of the other spatial humanities projects we looked at it in class had a specific endpoint, such as creating a graphic. While this does too, it still feels different because there is so much information. Here is a link to my map: https://davidrumsey.georeferencer.com/compare#289770556254!
I enjoyed doing this assignment, but it did leave me a little frustrated. After I completed my map, I accidentally hit next instead of save and it made me redo another map. However, I definitely think that this was a worthwhile activity. It made me realize that small inaccuracies on a map can lead to a greatly altered worldview. The region that I ended up focusing on was pretty much the whole world. I realize now that the creator of the map made the Western Hemisphere too far north in comparison to the Eastern Hemisphere. I think that the most interesting part of this project is seeing how the worldview of people through time has shifted. As we used to have such rough and barely accurate maps, but now we have a computer able to simulate a map for us anytime we want to go somewhere. Here is a link to the map that I rectified: https://davidrumsey.georeferencer.com/compare#map/472a7887-b183-5273-b412-790503afd083
This project helped me understand one way to take advantage of how everyone with a digital device connected to the internet can participate in the digital humanities. Although I don’t know much about spacial analysis beyond what we learned in class, I was able to contribute to acucmilating data, which would be impossible if it were not done digitally.
Here is the link to the map that I worked on.
https://davidrumsey.georeferencer.com/maps/d21d7ea5-e5d4-5f8c-ad43-bfe7ea89e5d2/view#658419776721
I georectified this map: https://davidrumsey.georeferencer.com/compare#27068997188
I enjoyed this assignment. I had never heard of spatial analysis before this class. Like Will, I also hit next instead of save on the first map I georectified, and I lost my work. On Some of the maps, discrepancies in the drawings made it difficult to located matching points. But otherwise, it was smooth sailing. It was an interesting assignment, and it made me realize how subjective maps really are. The color choices you make, the political boundaries you decide to recognize (like including or excluding a newly-formed country) all have an impact on the political statements your map makes. I chose to georectify a map of Virginia-Pennsylvania. I am already quite familiar with the region, having pored over maps as my family made our semi-annual road trip from North Carolina to New Jersey to visit family.
Here is the link to my map: https://davidrumsey.georeferencer.com/maps/dbd1bb2a-4648-5c7b-b763-364e43cb2f7a/view
The process of making it was pretty fun, and I felt that I was able to make a small contribution to this project. I also started to understand the importance of investing time in manual work to make old resources more accessible and useable for DH projects.
My map is here: https://davidrumsey.georeferencer.com/compare#
I realllllly enjoyed this activity! The software was really intuitive and fun to use! I think this work is the most interesting, specifically finding ways to visualize (or conceptualize) history with modern maps/images only furthers our understanding of what’s really going on. At least it helps me a ton!
1. Here’s a link: https://davidrumsey.georeferencer.com/maps/b87b1dea-ccc9-54e9-bc11-d780d4567706/view
This was a pretty neat process. It became much easier to do once I’d placed two points of reference (and realized that the blue on the old map was the river), which took quite a while. It was also interesting to see some major locations that I intended to use as landmarks didn’t exist when this map was made, while others that I didn’t consider important did.
2. This is a bit trickier. I can tell you right now that I’m a big fan of 3D Modeling and Digital Storytelling, but really don’t enjoy statistics work. I’m not sure what specific part of Carleton history I’d like to look into, but my first thought is that something involving the expansion of the school over time sounds neat to me.
3. I don’t know anyone else in the class very well, so I have no preference here.
https://davidrumsey.georeferencer.com/maps/ce0811e3-014f-5b25-876d-ac96519d29e7/georeference
This process at first was harder than I thought it would be. I got frustrated with a few maps before the process became clear. Once I stopped overthinking and figured out what I was actually doing, things began to make sense. I think it’s interesting to overlay the map of a different time in history. It shows how much is different and how much is the same! This is was a fun and interesting activity
Here is the link to the map I worked on: https://davidrumsey.georeferencer.com/maps/8fb4d7cf-3c9b-5f97-ae32-6f0d5bf06ad4/view.
I love looking at maps so the process was a lot of fun! It was certainly very interesting to see the subtle differences between the old and current map, especially very minor changes in state lines or slight changes in the curves and turns of the rivers. It certainly made me wonder how much difference is due to inaccuracy back then and how much is due to actually geographical changes.
https://davidrumsey.georeferencer.com/maps/ce882e69-df30-5b2a-83fd-3827eb557ac9/view
I chose Arizona because I initially thought it would be easier to match (due to its borders). When I started to closely work at it, I realized that matching the roads would be hard to do. This made me realized that trying to match older materials to current ones is super complex. It takes a lot of time to do.
This accuracy of these maps surprised me. The similarity between this valley in Yosemite (best seen through satellite view) and the old map ( https://davidrumsey.georeferencer.com/compare#133016658589 ) I overlaid was really impressive. This assignment probably didn’t really change how I see any of the previous things we’ve looked at so much as it opened my eyes to a new type of DH project. I also found out that I think old maps are really cool. I could scroll through maps for hours.
https://davidrumsey.georeferencer.com/compare#539871892105
I thought that, overall, the process of overlaying the maps was really cool. My map was of Louisiana so the clearly defined borders of the state made it quite easy to match points. Additionally, it was quite interesting to see how the maps differed and also stayed the same over the course of time.
https://davidrumsey.georeferencer.com/compare#44815096084
I think that this process showed the importance of documenting an dgeoreferencing. It also makes me marvel at the fact that people were able to create such detailed maps in a time in which technology was far less advanced than what we have today. Being able to reference important points on the map and overlay them fairly precisely was very cool to see and makes me understand the importance of cartography and what ArcGIS brings to this field.