In this project, I will be using a data set that analyzes movie data from various movie production companies. In particular, I thought it would be interesting to see if there is a correlation between the budget of a movie and the ammount of revenue that movie is able to generate. For this example, I will be looking at Disney movies. The tool I will be using in this example is called R Sudio, a platform that allows one to create and analyze complex data in csv files.
I think a project as such is useful because it relatively quickly you can evaluate quantitative and qualitative data and put it in a mathematical context. If I am working for Disney or if I am simply a movie fanatic, I could use a tool as such to understand the relationship between different variables pertaining to movies, such as revenue and budget. Beyond movies, however, R Studio has been used to produce very grand and complex research, such as US election data and gerrymandering, relationships between various communities and the amount of policing they experience, etc.
It is for this reason that I am using R Studio. It is a simple platform that can do very complex things with proper coding. In the context of research papers, I think that R Studio is one of the best platforms for data visualization. It won’t produce an outcome like an infographic, but it can produce output with color, different scaling, comparing multiple variables at once, etc. One of the best thing about R, however, is learning the code. Coding in R is intuitive and gets a little faster once you know the ropes.
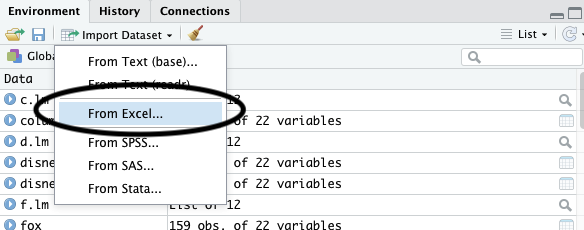
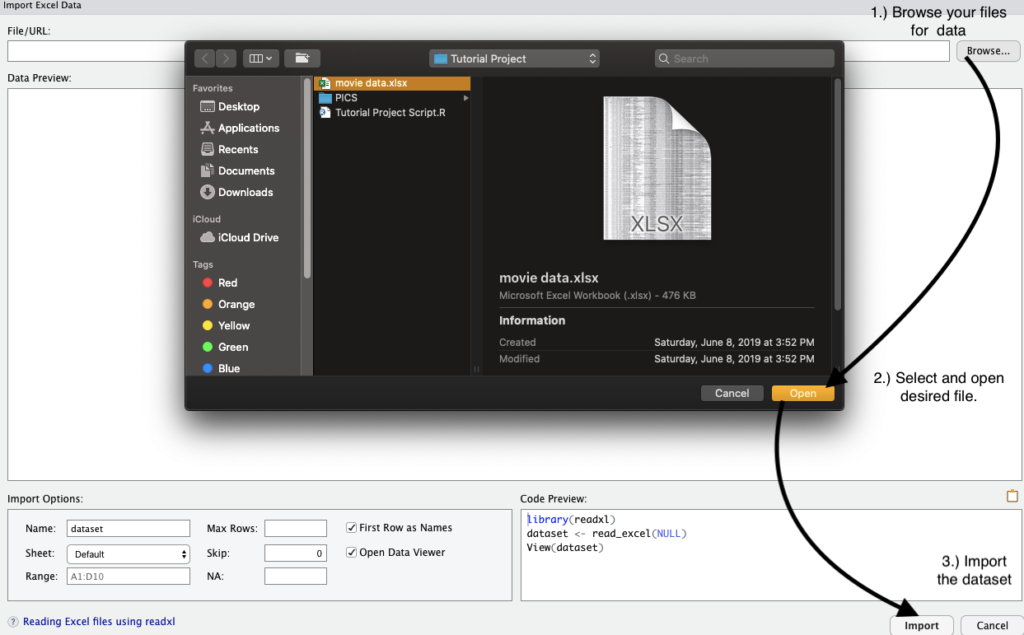
Step 1: Upload the raw data set into R studio as a csv file
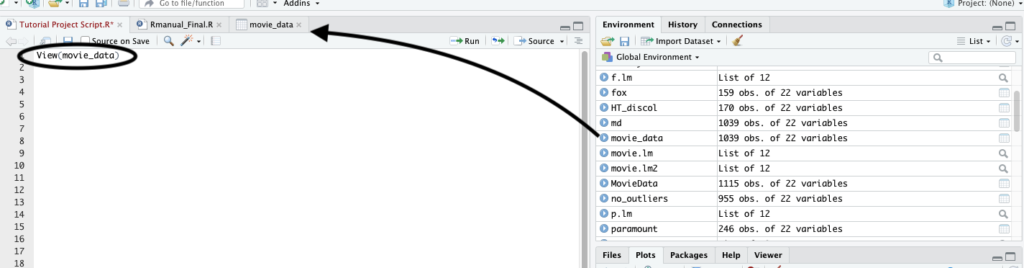
Step 2: Subset the complete dataset to just Disney
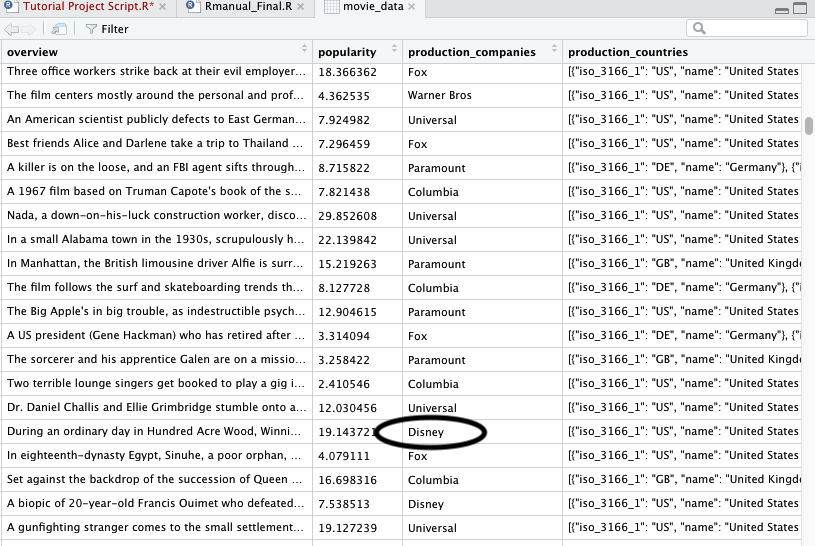
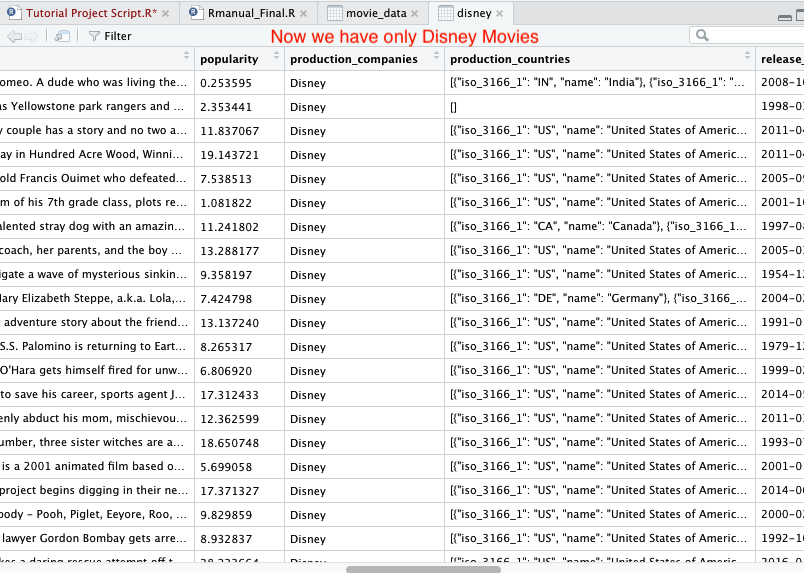
As seen below, the dataset contains other companies that make movies. We just want Disney movies.
Since this dataset is bigger than the scope of the project, we must subset the data to include just Disney movies. Using the following code and press “Run” in the right corner of the script:

Below is a view of the subsetted data. We will only focus on the variables budget(budMil) and revenue(revMil)
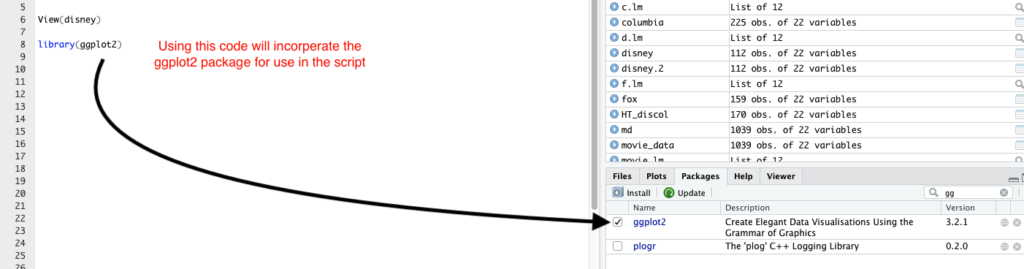
Step 3: Download the required packages to begin data visualization.
We want to use ggplots, so we have to download those packages using the code below and and pressing “Run” in the right corner of the script.
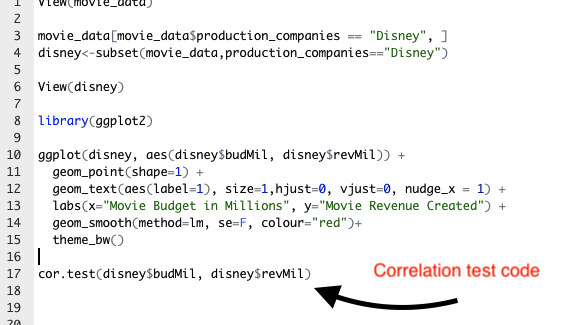
Step 4: Using the two key variables, budget and revenue, create a scatterplot. We do this using the following code and pressing “Run” in the right corner of the script.
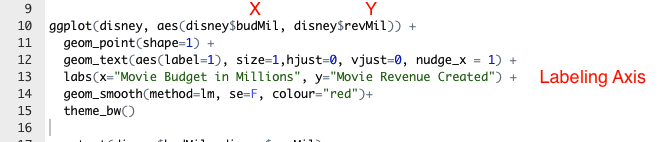
We set budget as the independent variable (budMil) and revenue as the dependent variable (revMil) and label the axis as such. The corresponding output is a scatterplot of all Disney movies with a trend line.
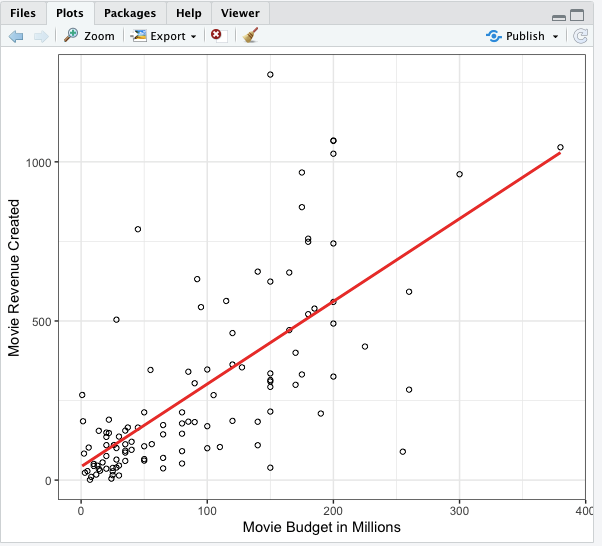
There is only so much that we can learn from this graph. We see trends but how do we quantify the relationship.
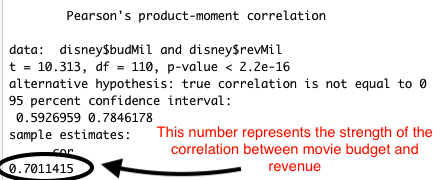
Step 5: Run a correlation test to understand the significance of the relationship between a Disney movie’s budget and the revenue it will tend to generate.
Below is the corresponding output.
Using this tutorial, you have successfully accomplished three important tools in R Studio, how to subset date, creating a scatterplot of that data, and testing the strength of the relationship. While this tutorial cover’s something trivial like movie statistics, I hope this inspires you to try these methods on something that you are passionate about and that can be useful.