ImageJ is a powerful image-processing tool that was created by the National Institute of Health. Although originally intended for research in the life-sciences, it has now become a popular tool used in wide variety of academic studies. It uses Java plugins and macros to sort, analyze, graph, and edit image data.
Before we get into the hands-on demonstration of what this software can do, I want to first explain two features of ImageJ that I think could be very useful in the context of the Digital Humanities.
The first feature is that it can take any collection of images and evaluate the median and standard deviation of images’ brightness, hue, and saturation. In other words, you can open a collection of images in ImageJ and it will analyze the brightness, hue, and saturation of each individual image and spit out a .txt file containing all of the the values within a matter of seconds. You can then open the file in a different software, like Excel, for further sorting, or do some data visualization.
This leads me to the next useful feature of ImageJ, which is that it can take a set of numerical data, combine it with a collection of images, and create a scatterplot with the images as the graphed points. Perhaps it is easier to show you rather than try to explain it any further.
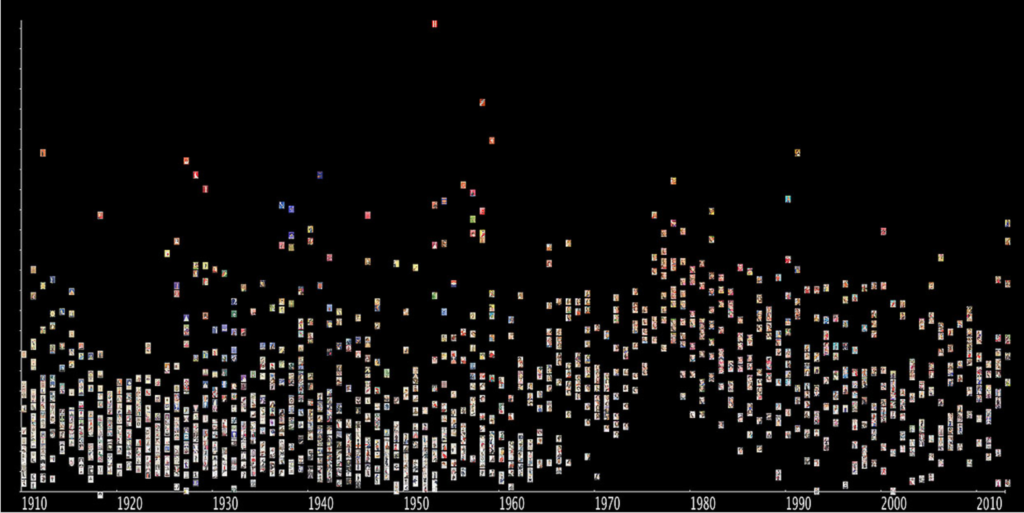
This may look familiar–it is from the “Colormetric Space” experiment by Robots Reading Vogue, which we looked at earlier in the term. They imported several hundred images into ImageJ and, using the macro Imageplot, they were able to graph saturation of color in Vogue covers against date of publication.
This experiment is just one example of how ImageJ can be used in digital humanities projects. It is a brilliant tool for large case studies and can answer large-n questions that might otherwise be many years worth of tedious work.
For example, ImageJ could help art historians answer questions like, has saturation in paintings increased as the price of good pigments gone down over the years? Or a political art historian might ask how/if political movements or events in history affected the brightness and tones of color in paintings. ImageJ could also help evaluate claims about unconfirmed authorship of art by analyzing a collection of confirmed work by a given artist and seeing if the art piece in question has a similar level of brightness and saturation as the confirmed works of art. As a more personal example, my group is considering using ImageJ in our final project for this class to analyze changes in the brightness/saturation/hues of the carleton.edu website.
Hopefully this gave you an idea of what sort of contexts ImageJ can be useful for Digital Humanists. Now, we can explore how you might go about making one of these scatterplots in ImageJ.
Step-by-step tutorial:
- First, go to this site and download the appropriate ImageJ/Java bundle for your computer.
- Next, go to this site, scroll down to the “download” section, and download the “ImagePlot_v1.1.zip” package. This includes a sample dataset Van Gogh paintings, along with its corresponding brightness/saturation/hue analysis. This will be the data that we use in this tutorial.
- Open up ImageJ and a toolbar should pop up (shown below).

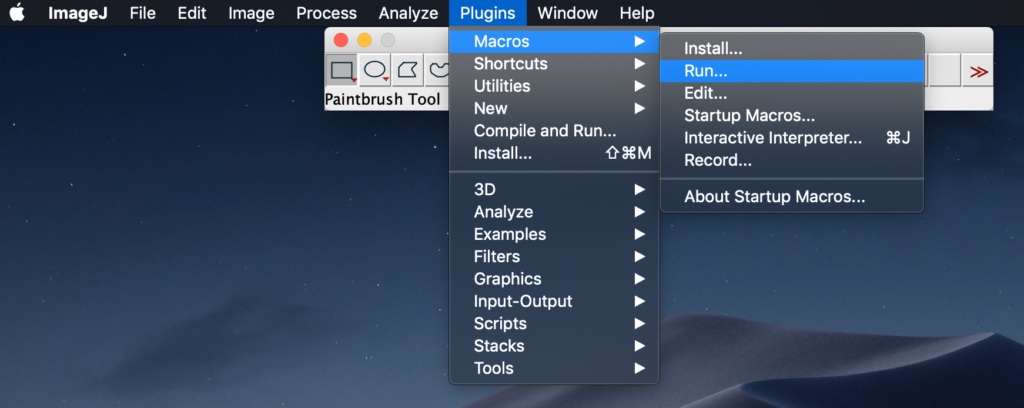
- Go to “Plugins” -> “Macros” -> and click “Run…“
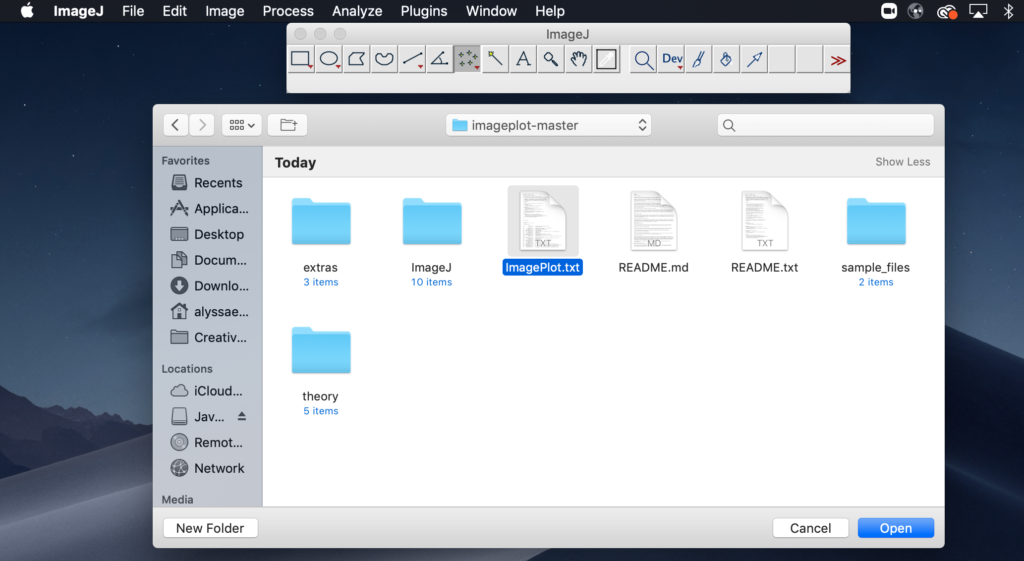
- A Finder window will open. In this window, find the ImagePlot folder you downloaded in the second step (it saved as “imageplot-master” in my downloads folder on my computer), select the file ImagePlot.txt, and click Open.
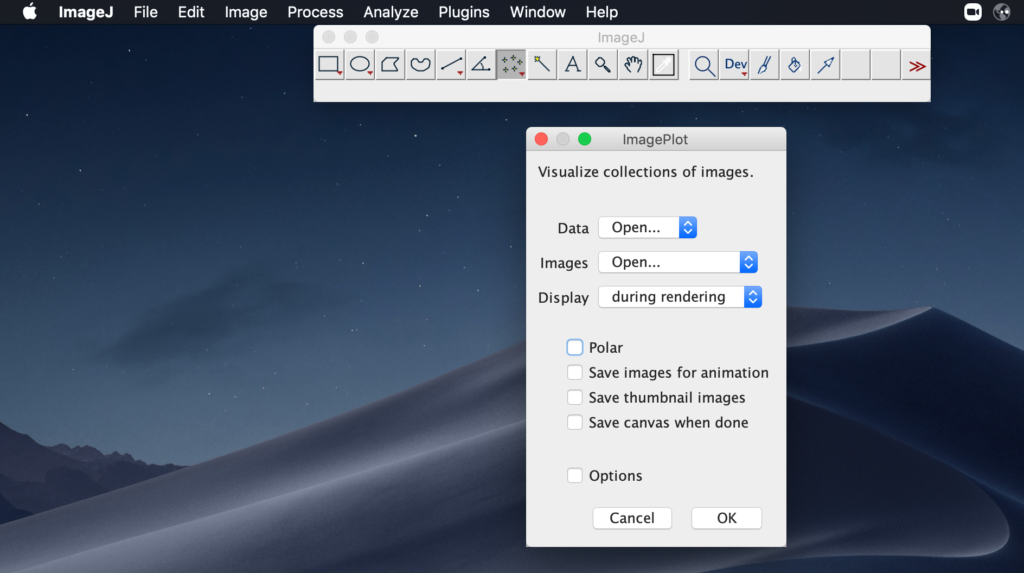
- When a small dialog window pops up, change the settings to match the image below. Click OK.
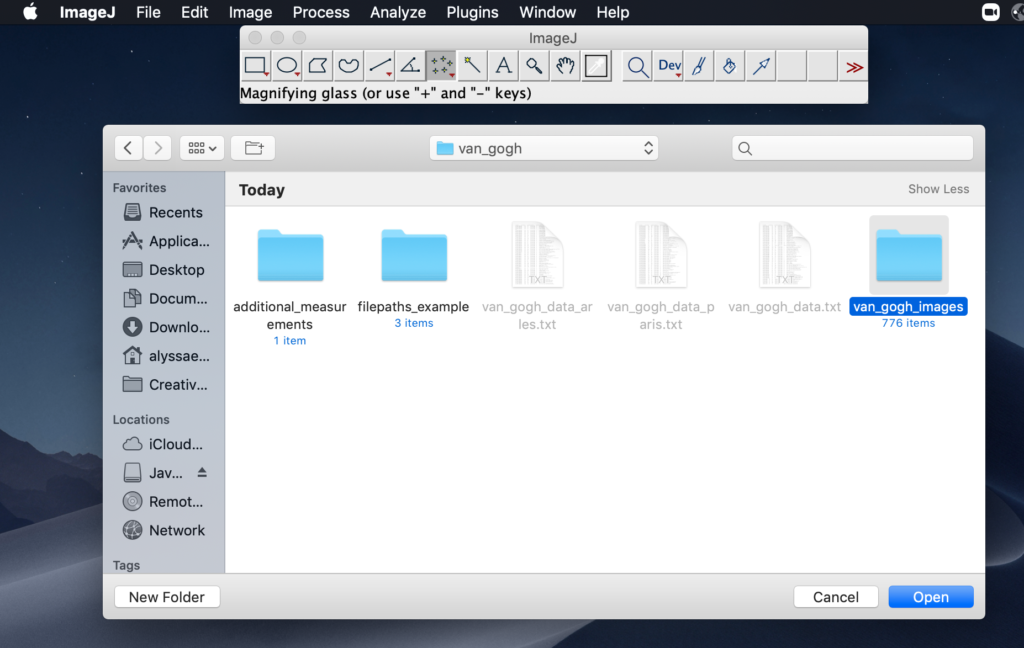
- When prompted to choose a datafile, go to the ImagePlot folder once again, double-click on the folder titled “sample_files,” then double-click on the folder called “van_gogh,” select the file van_gogh_data.txt and click Open.

- When prompted to choose an image collection, go to “sample_files” once again in the ImagePlot folder, double-click on the “van_gogh” folder, select the folder van_gogh_images and click Open.
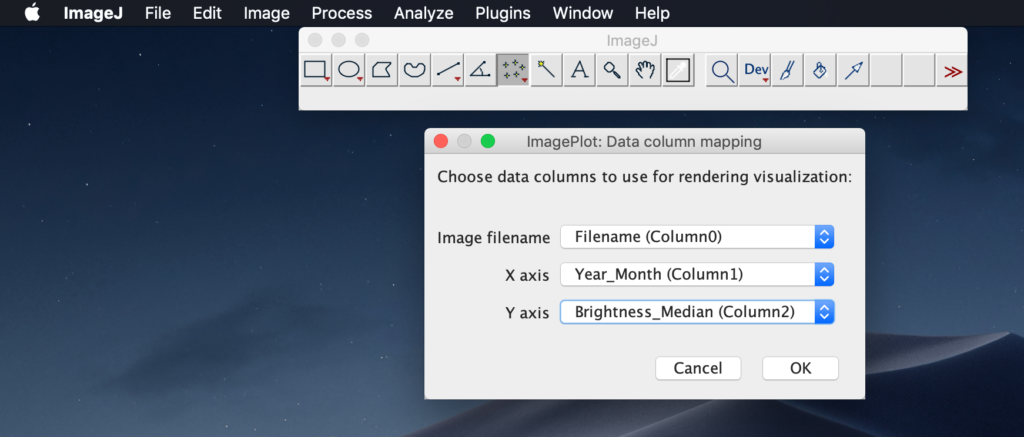
- The “ImagePlot: Data column mapping” box will pop-up, and change the settings to match the image below. Click OK. (Note: In this step we are deciding on the layout of the graph. For this tutorial graph, the x-axis will represent the year in which a painting was made, and the y-axis will be a scale of the median brightness.)
- A new window with the visualization will open (it may take a few seconds since they are over 700 images in the folder) and it should look something like this:
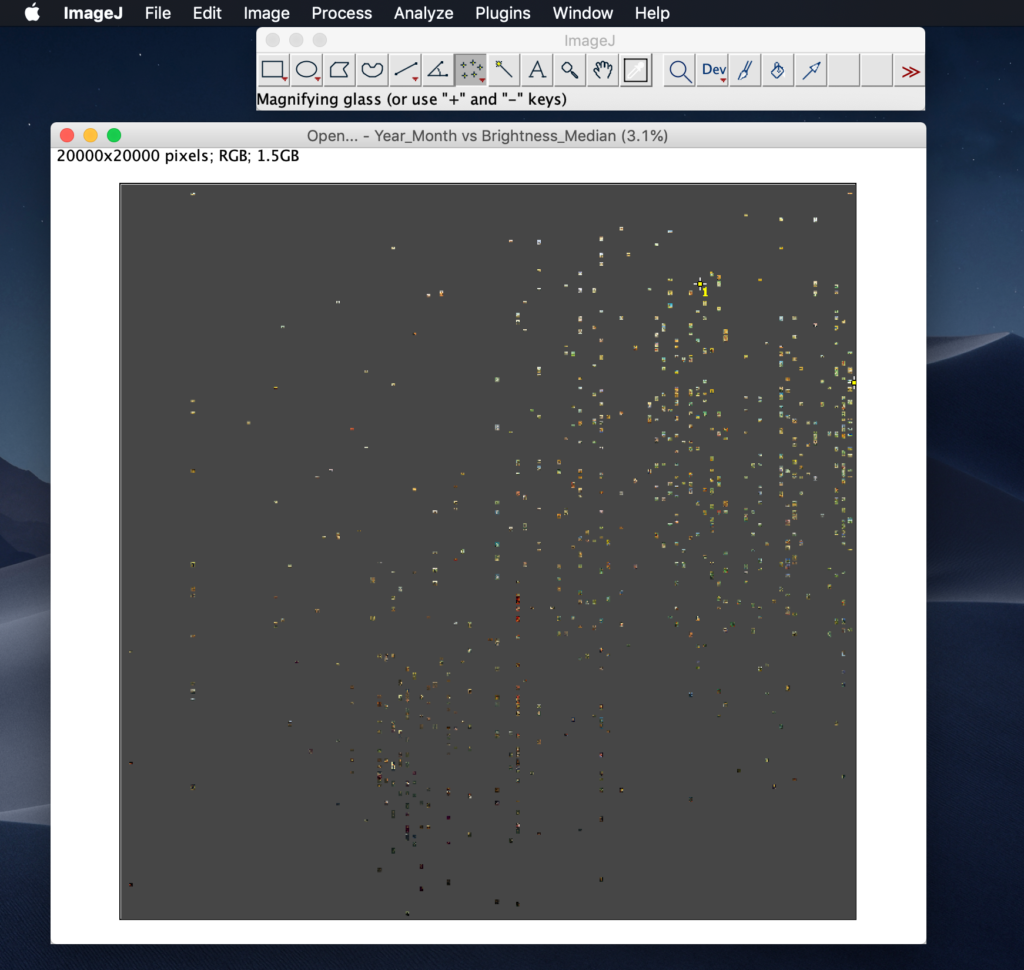
You’re all done! You have made a scatterplot of over 700 images of Van Gogh’s paintings and graphed the brightness of the paintings against the month/year in which they were painted. The higher the painting is on the graph, the brighter it is. A quick look at this graph and we can see that 1. very few of his paintings consisted mostly of dark colors, and 2. they got brighter later in his career.
ImageJ offers a lot more advanced analysis and graphing tools beyond what we covered here. But, even with this quick visualization, we were able to approach a broad topic, like the level of brightness in Van Gogh’s paintings, and extract information about trends and patterns that exist in the large collection of images. ImageJ makes data visualization of a large datafile a lot easier and less-daunting, regardless of the content of the data, making it a convenient tool for Digital Humanists.
Additional resources:
- A great PDF all about the macro ImagePlot and how to use it.
- Documentation of ImageJ, with links to various tutorials and tools (although they are mostly geared for scientific usage).
Your tutorial is very to-the-point and easy to follow and understand. Having gone through all of the steps you outlined above, I was able to successfully run the program and plot the image data.
I also liked how, before actually talking about how to use ImageJ, you described why one might want to use it in the first place.
This was a really great tutorial! Very clear and the steps were easy to follow. I loved how you explained some of the uses for this software at the end. I can definitely see this being used to study artists’ work at a large scope and not having to study each work of art at a time which would be a slow process. This speeds up some analyzation of the art and presents a great visual. Someday when I end up with a large amount of photos I’d love to try this out and see how my work trends.
This tutorial is really clear and helpful, and ImageJ seems like such an interesting tool. I really like how you discuss some potential applications of it before going into the tutorial. Reading this made me want to explore this tool more!
As previously said this was a very clear and detailed tutorial. I liked how you included screenshots of each step you took along with a brief explanation on what you were doing. This helped your tutorial move fluently and be done easily.