This tutorial is best suited for people with some JS/jQuery experience
In this short tutorial, you will learn how to use DataTables, a table plugin for jQuery, in 7 straightforward steps. With the help of this plugin, you will be able to add advanced interaction controls to your HTML tables – searching, filtering, and sorting will be ready to use without much effort! If you have ever struggled to keep *tabular* data organized and built effective filters, DataTables is for you. The tool is also handy for Digital Humanities projects involving tabular data visualization. Instead of having an excel file embedded or regular HTML table in your website, you can have an intuitive, functional, fast, and elegant table that will be valuable for users looking to explore your data further. Convinced? Let’s learn!
For this tutorial, we will use four columns and the first couple rows of artist_data.csv (yes, from our midterm) to get a feel of the power of DataTables. First, create an HTML file (1) and then create a simple table (2) – or simply copy the code below. You will have to add an id (3) to your table so to initialize the DataTable later.
<!DOCTYPE html>
<html>
  <head>
    <meta http-equiv="Content-Type" content="text/html;charset=utf-8" />
  </head>
  <body>
    <div style="width: 80%; padding: 2%; text-align: center">
      <table
        id="artist_table"
      >
        <thead>
          <tr>
            <th>Name</th>
            <th>Gender</th>
            <th>Year of birth</th>
            <th>Place of birth</th>
          </tr>
        </thead>
        <tbody>
          <tr>
            <td>Abakanowicz, Magdalena</td>
            <td>Female</td>
            <td>1930</td>
            <td>Polska</td>
          </tr>
          <tr>
            <td>Abbey, Edwin Austin</td>
            <td>Male</td>
            <td>1852</td>
            <td>Philadelphia, United States</td>
          </tr>
          <tr>
            <td>Abbott, Berenice</td>
            <td>Female</td>
            <td>1898</td>
            <td>Springfield, United States</td>
          </tr>
        </tbody>
      </table>
    </div>
  </body>
</html>
So far, nothing was new. However, the magic happens when you add the DataTable JS and jQuery scripts (4). Be sure to add the code below inside the head tag.
<script
      type="text/javascript"
      src="https://code.jquery.com/jquery-3.5.1.js"
    ></script>
    <script
      type="text/javascript"
      src="https://cdn.datatables.net/1.10.23/js/jquery.dataTables.min.js"
    ></script>
    <script
      type="text/javascript"
      src="https://cdn.datatables.net/1.10.23/js/dataTables.bootstrap4.min.js"
    ></script>
    <script type="text/javascript">
      $(document).ready(function () {
        $("#artist_table").DataTable();
      });
    </script>
Now, open your file in a browser (5); you should see a simple but functional DataTable. You can search by author’s name, gender, year of birth, and place of birth. If you click on the table head, you sort by ascending or descending order. And most importantly, everything happens almost instantly! We only have three rows in this example, but with tables with 1000 rows, this functionality is gold.
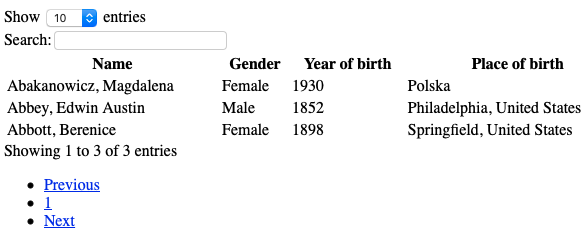
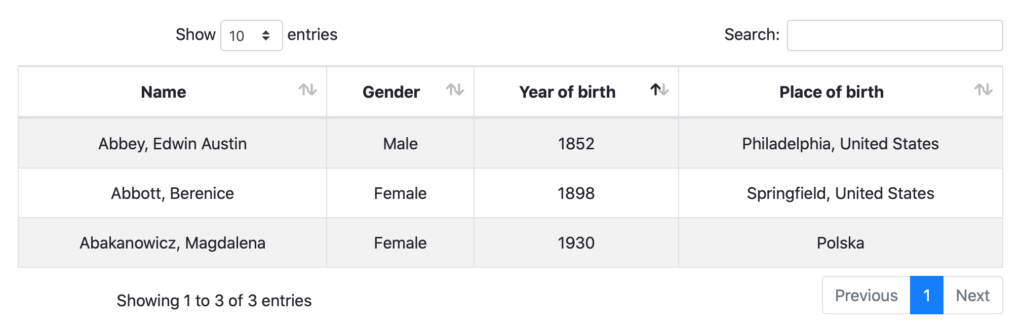
I know – it is ugly. But we can fix it! Have you heard of Bootstrap? It is a free and open-source CSS framework that makes everything beautiful without much effort. To add Bootstrap CSS to our simple table (6), we need to add some links inside our head tag before the JS scripts.
<link
rel="stylesheet"
type="text/css"
href="https://cdnjs.cloudflare.com/ajax/libs/twitter-bootstrap/4.5.2/css/bootstrap.css"
/>
<link
rel="stylesheet"
type="text/css"
href="https://cdn.datatables.net/1.10.23/css/dataTables.bootstrap4.min.css"
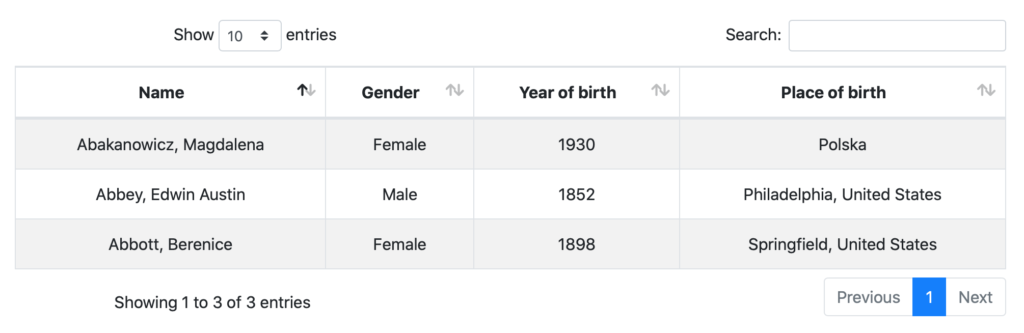
/>Now we just need to indicate what we want to style, so we add a class to our table (7): class=”table table-striped table-bordered” and a small style style=”width: 100%”. Refresh your browser and enjoy 🙂
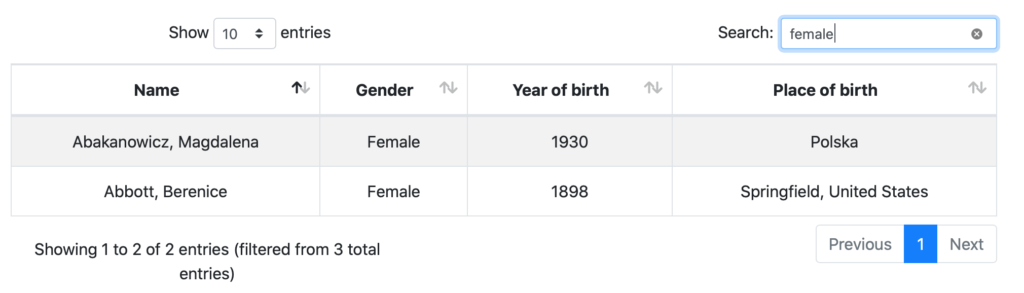
What else can you do with DataTables? Check this list! If not, here is a small spoiler: Add custom filtering by range search, add DOM/jQuery events and read HTML to data objects. All of those features have several applications in Digital Humanities projects. For instance, we would be able to filter the authors by birth year range and get a subset of authors to do further analysis.
If you need it, here is the complete code: https://drive.google.com/file/d/1pc55E4Yohu-p8hy8GTjsPCNrtIThhur8/view?usp=sharing. And congratulations! You are ready to create beautiful tabular data visualizations for your DH projects.
Thanks for sharing, Luisa! I definitely can see just how powerful a tool this plugin is, and really appreciated your step by step implementation! It made it really easy to follow along, and I’m excited to see how I can utilize this plugin in the future!
Thanks Dominic! I’m really glad you liked it!