As someone who is working on her Stats comps on network analysis, I found it quite interesting to see how networks could be applied to different areas in the humanities. The project I decided to explore is called Using Metadata to find Paul Revere.
The researcher constructed network graphs to show the relationship between individuals and the organizations they belong to. The datasets used in the project were collected by the project’s field agent, and the researcher converted them into adjacency matrices to create the network graphs.
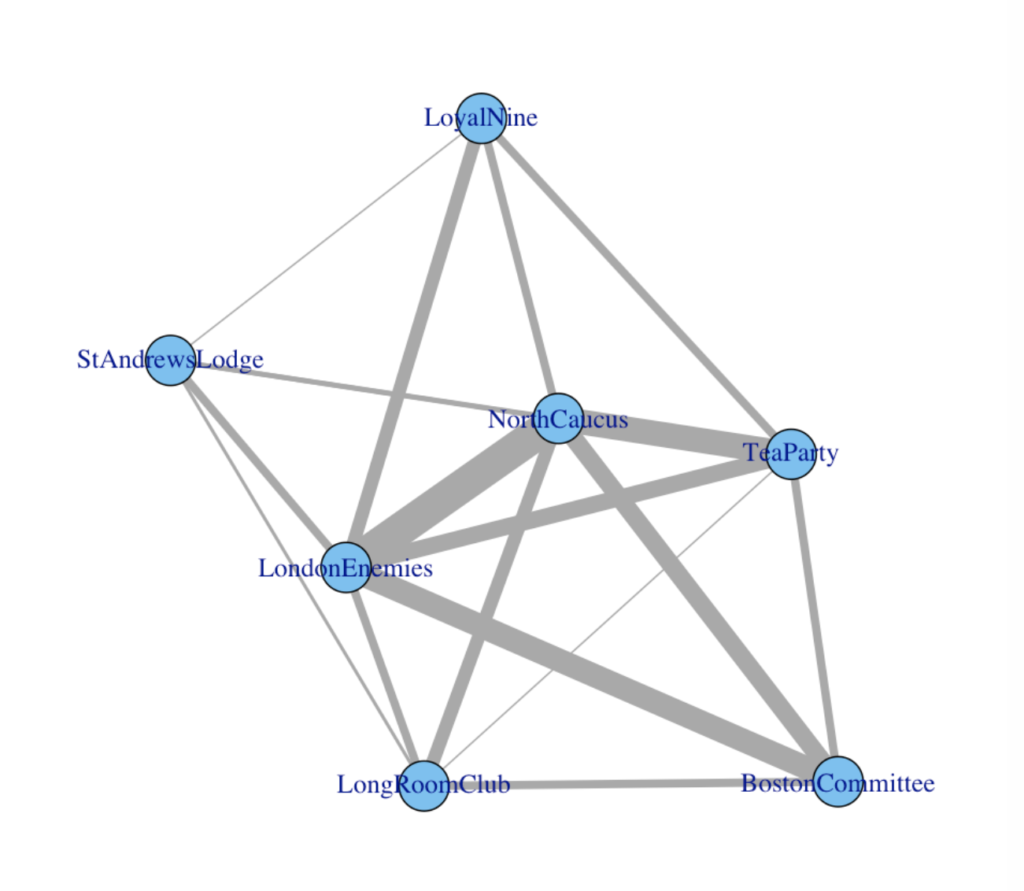
The first graph the researcher presented shows the relationship between organizations. The nodes represent each organization, and two nodes are connected by an edge if the two organizations share at least one member. This is a weighted undirected graph, and the width of edges reflects the number of shared members between two nodes.
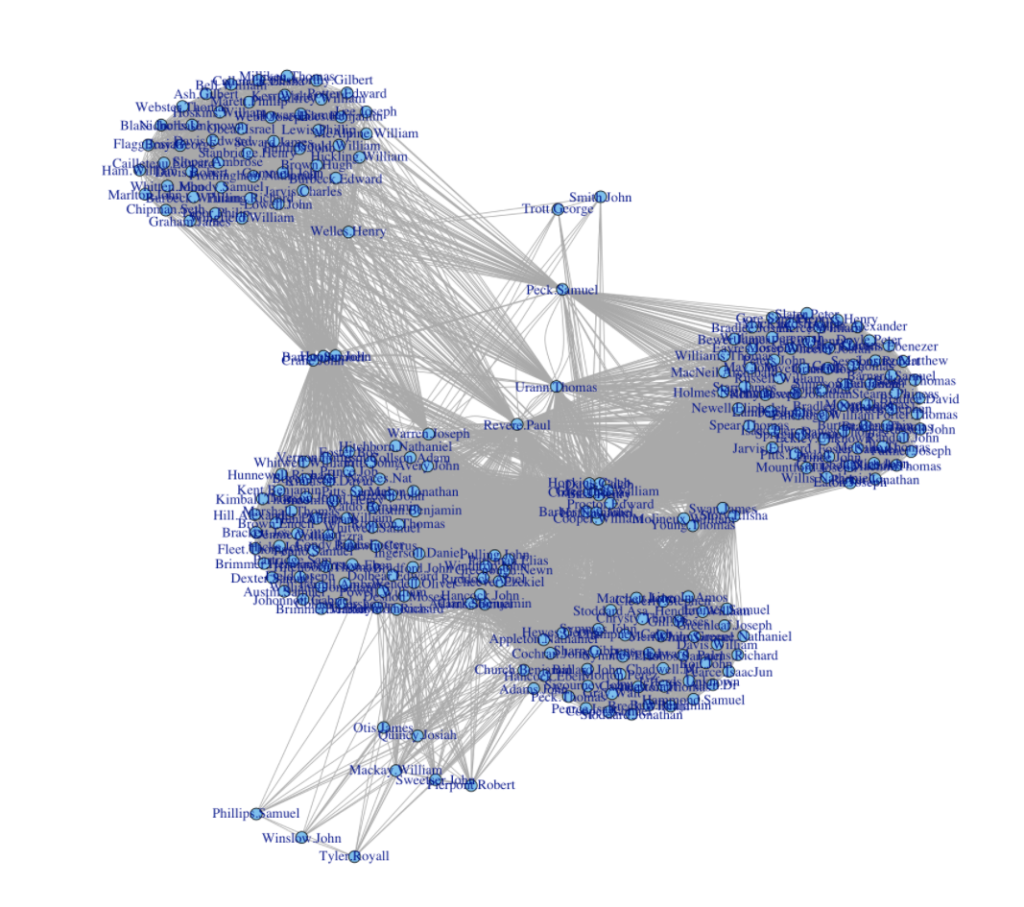
The second network shows the relationship between individuals. The nodes represent each member, and two nodes are connected by an edge if the two people belong to the same organization. This is also an undirected graph, but I couldn’t tell if the edges were weighted. This graph is particularly interesting to me since there are obvious clusters, and people seem to be connected with at least one other person; it’s surprising that there are no singletons. After creating graphs, the researcher calculated three centrality measures to identify the most prominent actor, in this case, Paul Revere.
I think network analysis is such a powerful tool. Even without any contextual information, building a network allows us to see complex social relations and to understand the dynamics that drive community creations.