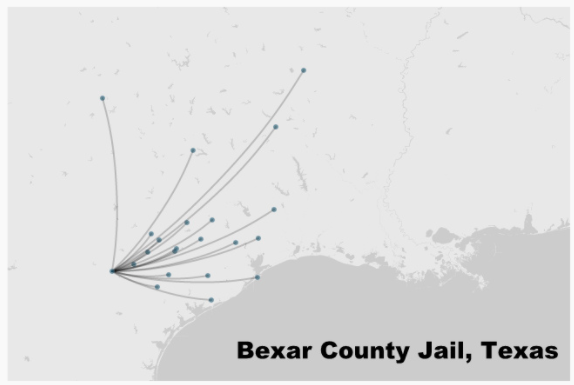
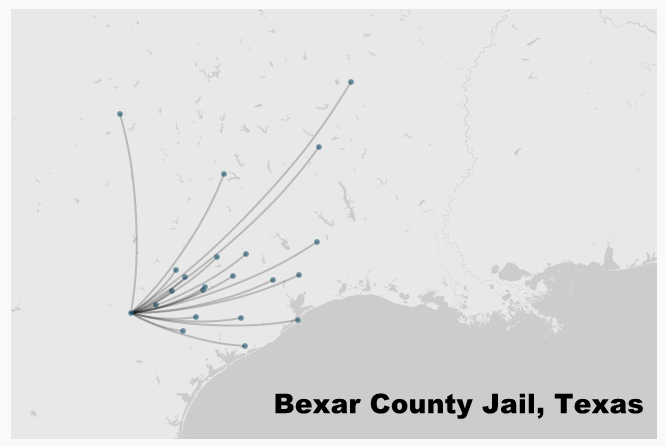
Each node in this project was a re-captured, escaped slave. The project did an interesting job tracking the paths of runaway slaves. Runaway slaves typically had one of a couple strategies. The first, was to lay-low near where they had been captured. The second was to run, whether to family or freedom. There were three main data points used in this project: Arkansas, Mississippi, and Texas. This project looked at the directions from which captured slaves had come. In Arkansas and Mississippi, slaves came from near and far, but from all around. In Texas, distance was still variable, but direction was not; all the slaves captured had come from the East. Presumably, many of these slaves were trying to get to Mexico. Additionally, few slaves lived west of the chosen data point in Texas, which may have also helped these results.
To create this data set, the authors looked at county jail notices from the late 1850s. These notices included both the jail location as well as the owner’s location, as reported by the slave. Palladio was used for the visualization of this data. The author’s complain about the user interface of Palladio on multiple occasions, but the results look good.
This is very interesting! I thought more/most escaped enslaved people would attempt to travel north during the time, which could still be true generally since the data are reflected by the local jail postings (and the fact that Texas is really down south).