Data visualization is important when analyzing and presenting findings. As working with excel is already so accessible, using PowerBI is a no-brainer when it is so seamless.
Power BI is a business analytics service by Microsoft. It aims to provide interactive visualizations and business intelligence capabilities with an interface simple enough for end users to create their own reports and dashboards.
Step 1: Install PowerBI
You can install it here or through the Microsoft Store.
Step 2: Load data into PowerQuery
- Try using a sample dataset. Select all the sheets available, and then select transform data.

Now that we are in PowerQuery, we can clean and transform the data. It is a good idea to have a narrow and long dataset, so we’ll get rid of columns we do not want. To do this, you can click on a column and select Remove Columns in the ribbon.
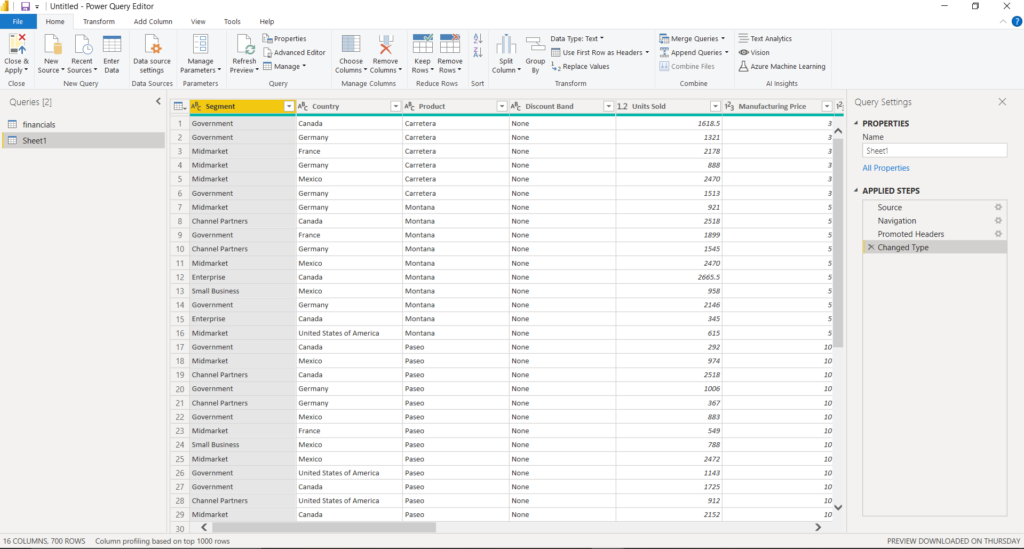
After you are done, select Close and Apply.
Step 3: Creating visuals
Now that we are back in the dashboard view, select a visualization from the column on the right, then add fields from the data to create a visualization.

Here we have selected the stacked area chart visualization to understand how sales fluctuates for different products over the quarters. From this you can easily tell that Paseo falls in the 3rd Quarter but picks up a lot in the 4th. Multiple visuals can be combined to tell a story, like so:

Here we see that in Quarter 4, Canada was the largest consumer of Paseo. This could perhaps inform a company that they might want to promote Paseo in other countries more as Canada seems to have a more established customer base.
There are multiple visualizations, and PowerBI’s main selling point how well it lets you connect to your data sources, visualize and discover what’s important, and share that with anyone or everyone you want. It is a powerful tool for business intelligence, and if you wanted to be an expert, Data analysis expressions (DAX) will allow you to dive deeper into the code behind the data.