Historians have long understood the importance of redlining. Yet by using digital mapping software to organize, analyze and display historic data about this practice, this project retold the story in way that made it accessible for a popular audience.
Mapping Prejudice website, “About Us”
Mapping Prejudice is a digital mapping project that seeks to expose structural racism within Hennepin County, Minnesota. The project consists of a database of racial covenants visualized on an interactive map to show “how these racial restrictions were embedded in the physical landscape”. Mapping Prejudice argues that discriminatory housing policies prevented non-white people from buying property and accessing community resources, creating racial wealth disparities that still exist today.
Sources
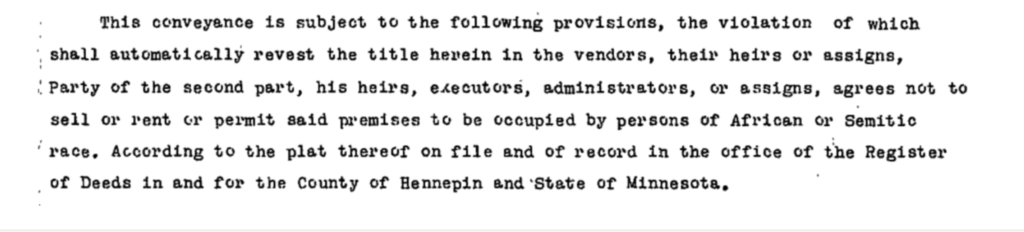
According to the website, “racial covenants were tools used by real estate developers to prevent people of color from buying or occupying property.” These were clauses within warranty deeds that prohibited non-white people from living in certain areas, effectively enforcing residential segregation. To complete this project, Mapping Prejudice used over a million recently digitized property records from Hennepin County to identify racial covenants.
Processes
The team used optimal character recognition (OCR) scripts to scan through the digitized records and flag images that contained racially suspect language, reducing the dataset to 35,000 records. They then invited community members through an online crowdsourcing platform to read the deeds and indicate whether they had a racial restriction on them. If they did, they recorded the document number, date, grantor, grantee, addition, block, and lot of each deed. They then used the geographic information (addition, block, and lot) to locate the covenant on a plat map of Minneapolis.
Presentation
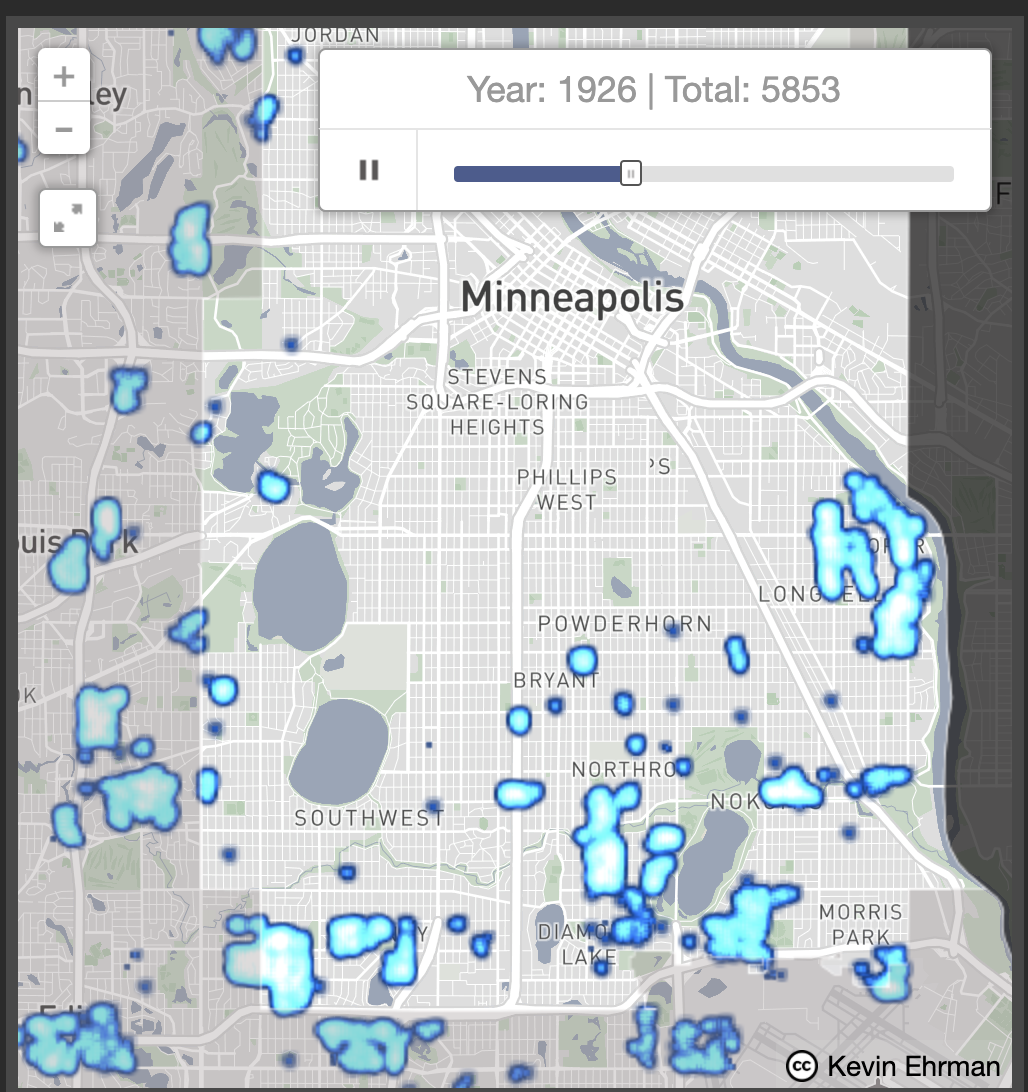
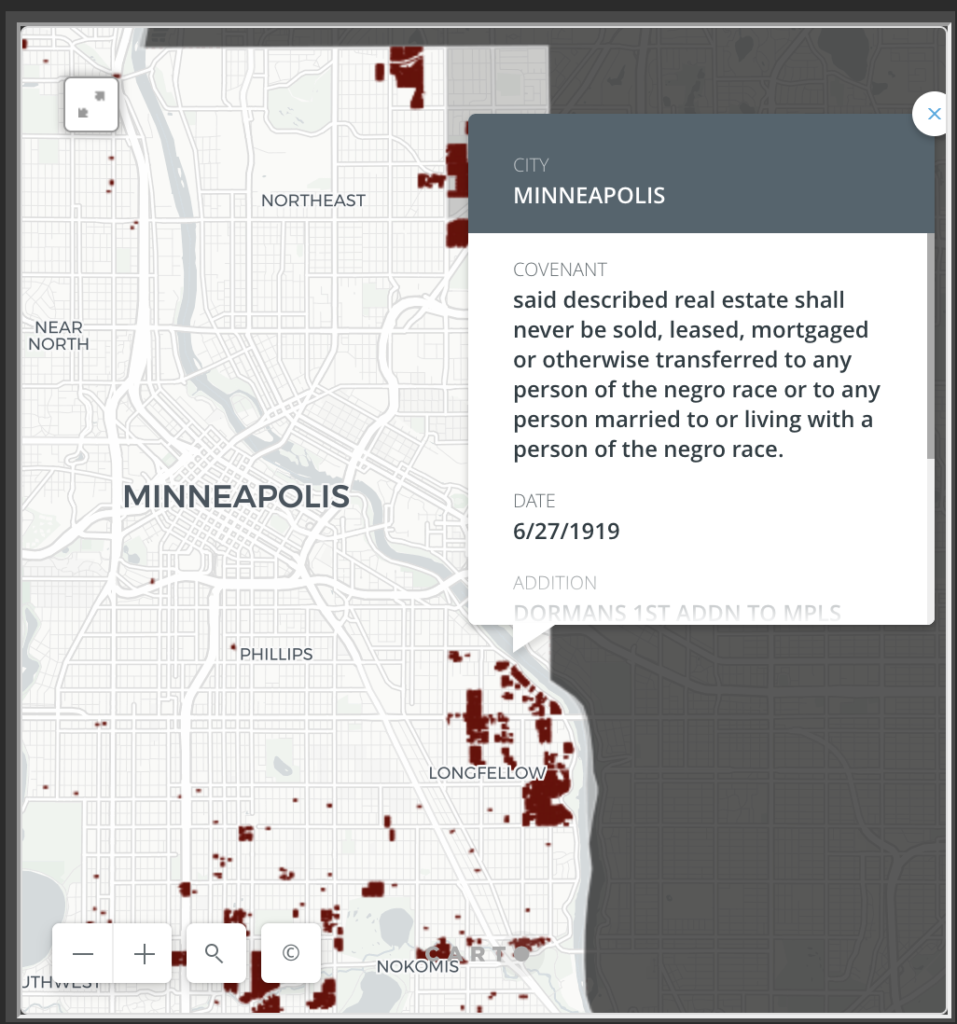
Once they had compiled a sizeable database, the team visualized this information using GIS mapping software. The primary component of the project is a timelapse that shows the spread of racially-restrictive deeds across Hennepin County from the year 1910 to 1955. There is also an interactive map that allows visitors to explore each individual deed in-depth. In looking at the maps, visitors can see how racial covenants proliferated throughout the Minneapolis metropolitan area, particularly in the suburbs and southeast areas of the city.
These maps are intended for a public audience with an emphasis on residents of Hennepin County. The inclusion of community members and local activists within the process allows them to feel a sense of ownership towards the project. Mapping Prejudice thus bridges the gap between academic scholarship and the public to create a collaborative and community-inspired project.
Although it’s grounded in history, Mapping Prejudice hopes to change the future. The teamhopes the project “will be a powerful community resource that should serve as a foundation for productive community conversations and fact-based policy making”. In this manner, Mapping Prejudice hopes to use the past to guide the present and evoke meaningful change.