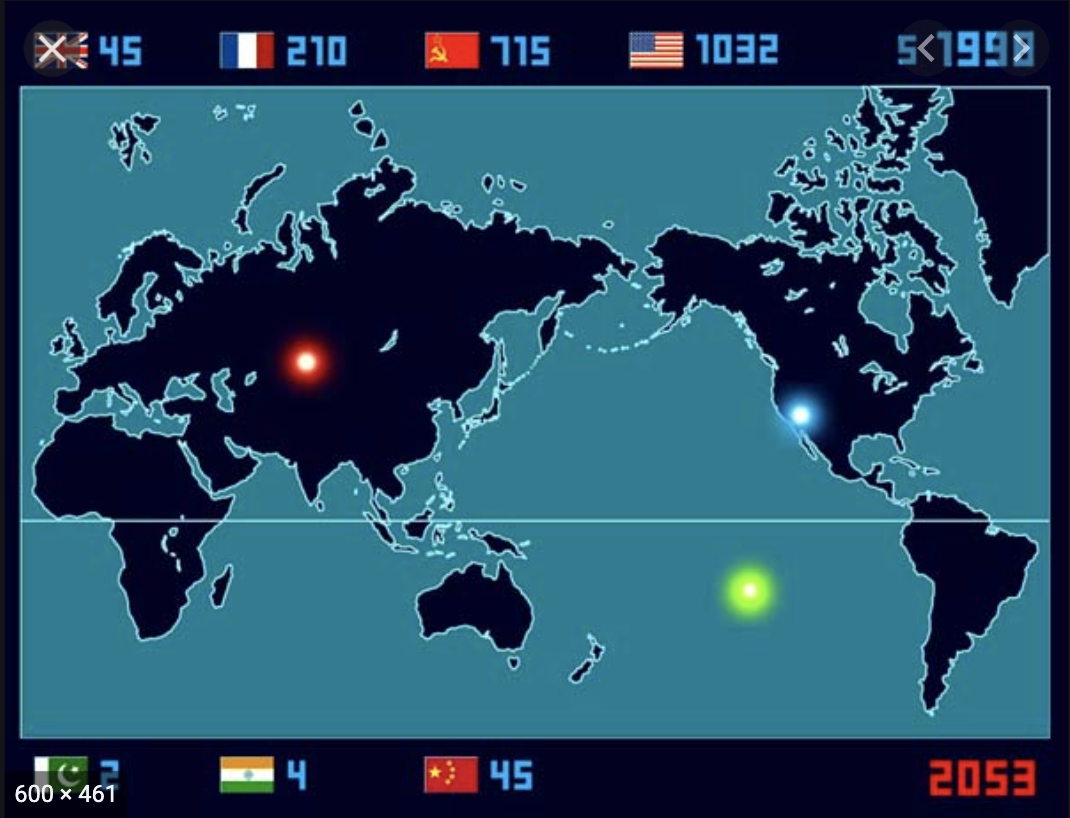
There have been 2,053 nuclear explosions since 1945. In “2053”, Japanese artist Isao Hashimoto shows every single one in a time lapse that is both beautiful and terrifying. This work conveys the power of data visualization to tell stories and express ideas.
The video opens with a map. It moves slowly through three nuclear explosions, all occurring within the year 1945: the Manhattan Project’s “Trinity” test near Los Alamos, the destruction of Hiroshima, and the bombing of Nagasaki. An eerie silence pervades the video except for the audio of the bomb when it is dropped, emphasizing the abnormality of the explosion. In the top right corner, a month and year are visible for each explosion and a counter next to the American flag tracks how many nuclear bombs the US has detonated. So far there are three.
Suddenly, the months begin to increase with a ticking sound that is reminiscent of a bomb, creating a feeling of anxiety. As time passes, glowing circles of color appear throughout the map that represent different explosions. The longer the viewer watches, the more countries join the United States in detonating nuclear bombs. Each explosion issues a beeping sound, specific to the country of origin, that creates a horrifying yet mesmerizing song. By the end of the video, there are 2,053 data points.
Hashimoto collected the following data on each nuclear explosion from 1945 to 1998: the location, the month and year, and the country of origin. Each unique data point appears on the map according to the date and place of occurrence, with the color and sound of the point signaling the country of origin. A summary of the cumulative data appears at the top and bottom of the map with a count next to each nuclear country.
In this work, Hashimoto combines visual graphics, sound effects, and data to craft a compelling and cautionary story about nuclear bombs. Hashimoto, who began the project in 2003, says he created it with the goal of showing “the fear and folly of nuclear weapons.” The data visualization effectively accomplishes this goal, illustrating to the viewer how pervasive and frightening nuclear weapons have become. The overlapping music of each explosion becomes overwhelming and it becomes increasingly harder to follow each individual detonation, particularly as more countries join and the explosions become more frequent. This effect coupled with the ticking of time creates a sense of urgency and indicates to the viewer that it is only a matter of time before nuclear weapons are beyond our control.
“2053” speaks to Lin’s discussion of data visualization as a storytelling device. In creating any graph, the goal is to find and show stories in data. Data thus serves as a visual argument that is deliberately crafted by someone for a particular purpose. Keeping this in mind, it’s important to remember the subjectivity and bias of data visualization.
Hi Grace! I also thought that the combination of the unique visuals and audio symbols made this video both fascinating and terrifying. I also liked it for the reason you mentioned, that it creates a powerful narrative without actually saying any words.
Great post! I looked at this visual as well. What you said about how this visual shows the pervasiveness and fearful-ness of nuclear weapons is so true. Especially with the huge increase of colored dots on the screen as time goes on.
Grace, I really enjoyed reading your analysis of Hashimoto’s work! I definitely agree that he accomplished his goal in a really powerful way. I also really appreciated your point regarding how this piece highlights that storytelling, regardless of medium, is by its very nature going to have a layer of subjectivity to it.
Hello Grace! I like how you discussed the role of audios and sounds in conveying the artist’s argument. In my visit to a TeamLab installation last year, the musical ambiance made the experience much more immersive and mesmerizing. Here is a YouTube video about the exhibition: http://www.youtube.com/watch?v=UYFWjUj4RPQ