We’ve spent the first few weeks of term getting a crash course in the technical infrastructure of web-based digital projects, and we have looked at how Content Management Systems like the WordPress platform this site runs on process and present data.
For most Digital Humanities projects, however, the data are going to be much more structured than blog post content. Figuring out how to model real world data in a way that let’s you answer your question or meet the goals of your project is a key part of any endeavor.
As you read through the articles assigned for this week, you’ll encounter repeated use of modifiers for data and you might be a bit lost. How does metadata differ from data? What makes your data clean, or tidy, or smart or normal?
Today we will discuss these issues in class, and then get introductions to a few tools to work with metadata and clean data.
NOTE WELL: humanities sources are wildly varied and contain lots of uncertainties, and creating structured data out of them is a very messy process! If you are making your own data, you have a lot of choices to make and none of them will be perfect. If you are using someone else’s data, chances are there are going to be problems with it or things you would have done differently. You won’t “get it right” from the beginning, and you may need to go back over your work several times as you figure out better ways. That’s totally normal — the key is to keep an open mind and good notes on your decisions and issues so that you know what you are did and why.
There are many many MANY ways to do this kind of data manipulation from code based solutions (most commonly in DH and data science circles using the Python or R languages), to simply using find and replace in spreadsheets like MS Excel or Google Sheets.
We are going to use OpenRefine to clean our data, which we will then import to a Google Sheet to create a timeline in the KnightLab’s beautiful TimelineJS framework to show you some of the steps that often come up in DH project work.
We’ll step through the process of taking a data table of art history data and cleaning it up, and then turn it into a nice looking visualization as an interactive timeline.
Metadata and Zotero
Brandon Walsh has created a helpful online book with resources and lessons on text analysis (which we’ll discuss in more detail later in this course). He includes a good discussion on metadata and the importance of data cleaning — which is a fundamental step in any project, whether storing data in a flat table or relational database.
We’ll read through the post on data cleaning, and step through how to setup up Zotero, if you haven’t already. Think about how the metadata are stored and how this database works, as opposed to the WordPress instance.
Omeka and Metadata
Metadata about books is fairly standard and we know (through academic training) how to model a book as a dataset of book metadata.
Not all sources are books, however, and we will discus the college archives and collections, which you will most likely use for your final projects.
Our awesome librarians have set up a course guide for us that should be your starting point for entry into the archival holdings.
START HERE: Library Course Guide for IDSC 130: Hacking the Humanities
- Search through some of the resources on offer here.
- What types of sources are there?
- How might you model them as data?
Sometimes in can help to map your data to an established schema, such as the Dublin Core metadata schema employed by Omeka. Our excellent librarians provided last year’s class with detailed guidance on how to translate the metadata about building photos found in the archives into the standard DC fields.
- Open this Librarian guide of Best Practices for Metadata
- Go to File > Make a Copy and Save it in your shared course folder
- Find an item in the college archives and work with your team to figure out how to map its metadata to the DC schema, and fill in your form (HINT: there are no wrong answers!)
Omeka
Omeka is a content management system and web publishing platform, much like WordPress or Drupal.
A few things set Omeka apart and make it a favorite for DH projects
- It was created by humanities scholars specifically for humanities projects, unlike most other platforms that have had to be hacked for humanist scholarship. Specifically, it was built by the folks at the Center for History and New Media (CHNM) at George Mason University, who also developed Zotero.
- It has robust support for metadata, by default the Dublin Core specification, a set of categories widely used by libraries, museums and cultural heritage organizations.
It’s primary use is in building collections—of documents, artifacts, images, etc.—and then organizing them into categories and allowing you to build Exhibits that tell a story from your primary sources.
An Example Project
The repository we used for last year’s class project on Carleton’s building history is one I set up through my Reclaim Hosting server:
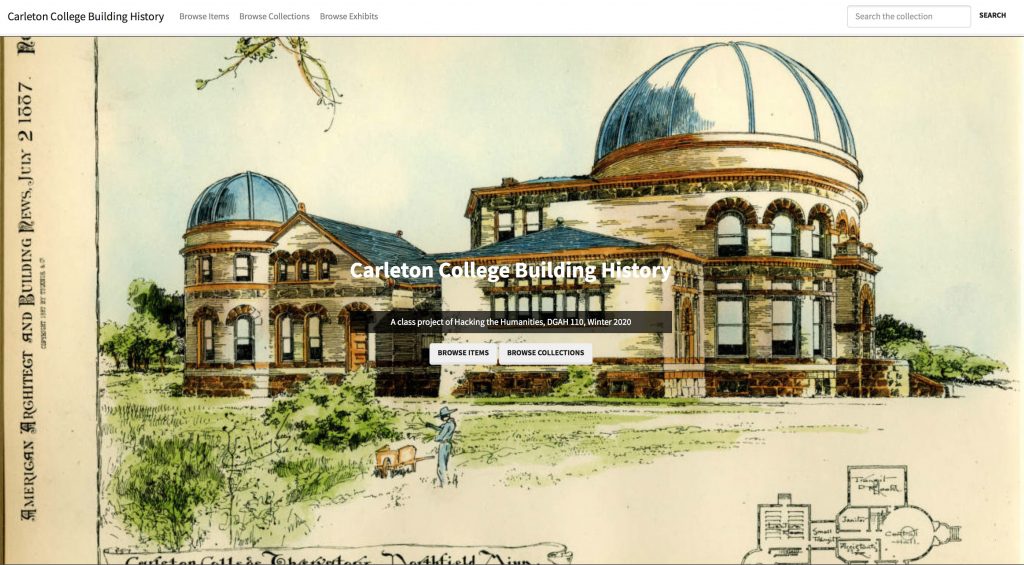
Carleton College Building History (https://campushistory.medhieval.com)
Click the link above to explore the front end of the website.
- How is the site organized?
- How is it similar to, or different than, the sites we’ve interacted with before?
- What ways are there to navigate around and find the content you desire?
I will log in and also show you the backend administrative interface. Have a look around and compare this view of the repository to the front end.
- What can you do as an admin that you couldn’t do as a user?
- How is the organization similar to our different than WordPress?
Omeka Resources
For a good introduction to Omeka, see Johanna Drucker’s Omeka 101
For more overall introduction to Omeka and instructions on setting up free accounts with Omeka.net, see these two tutorials from Miriam Posner at the Programming Historian site:
For information on CSV import, customizing themes, Neatline and more, check out this fantastic and detailed Omeka admin guide for getting started up Omeka.org with the most common and useful plugins from Nicole Riesenberger et al. at UMD.
Cleaning Data with OpenRefine
OpenRefine is like a spreadsheet program but with extra special features that let you perform batch operations to clean data and turn messy OCR’d or scraped text into nice regular tabular data.
Here are the data manipulation tasks we will take with OpenRefine
- Clean up spelling inconsistencies
- Remove extra white space
- Format dates and numbers using regular expressions
- Extract and combine values
Note: Extracting Text from PDF
We are starting with table data here, but many projects will first need to pull data from PDF files using Optical Character Recognition. There are many ways to get OCR’d text out of a pdf, from APIs to python utilities to copy/paste. If you are on a mac, one of the easiest is to set up an automator script to generate output from any PDF you drop on top of the application.
1. Install OpenRefine
Head to www.openrefine.org/download and download OpenRefine. It’s available for Windows, Mac and Linux
NOTE: If you’re on a Mac and, when you try to open OpenRefine, you get a message saying that you can’t open software from an unidentified developer, do the following: right-click the program and choose Open, then click Open again.
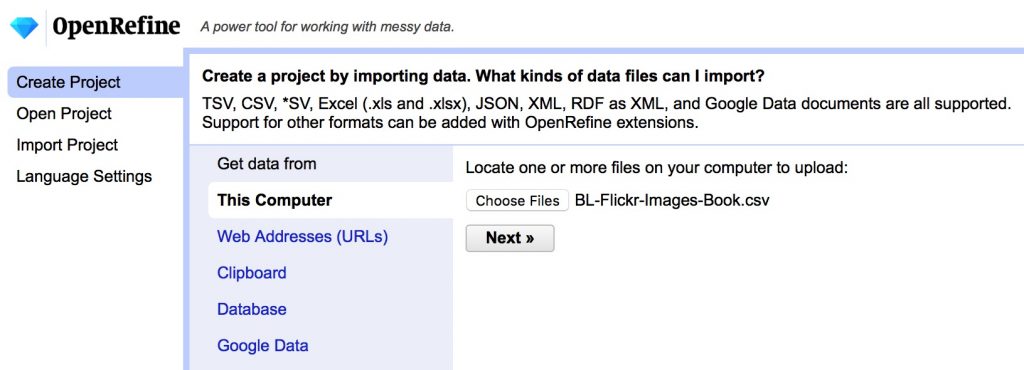
2. Download our sample data
We are going to be using a sample dataset developed for an “Introduction to OpenRefine,” tutorial developed by Owen Stephens on behalf of the British Library. We will use the same data, but do slightly different things with it today.
- Download the data from github here
BL-Flickr-Images-Book.csv - Save it to your hard drive as a .csv file to import into OpenRefine
3. Clean data in Open Refine
We will walk through the steps together but this is what we are going to do, along with some text you’ll need to copy and paste to get going
- Import the data and create a project
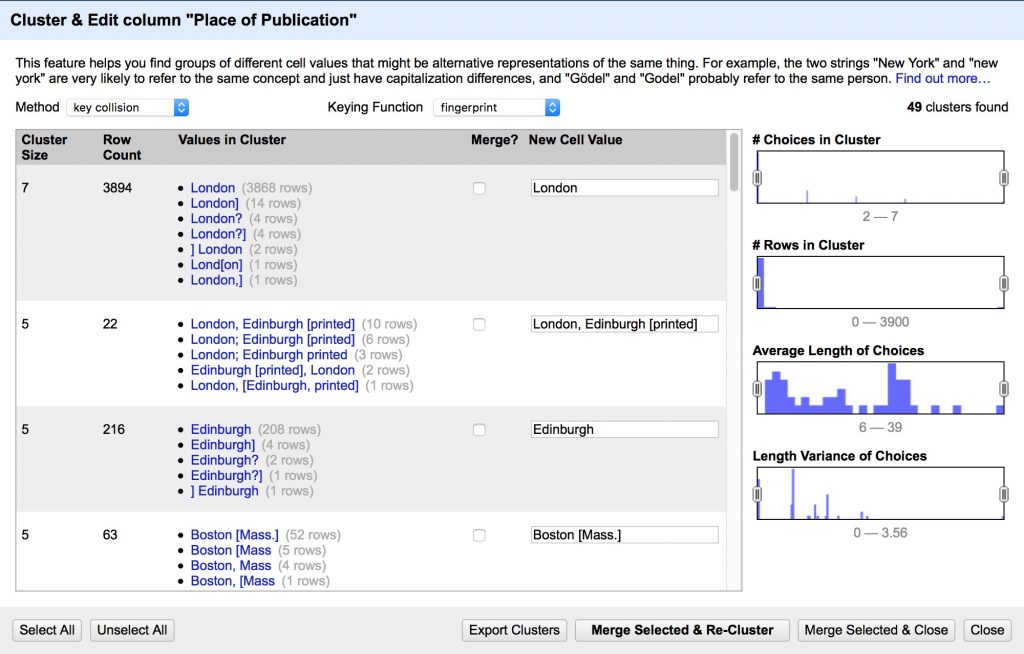
- Create a text facet on Place of Publication field
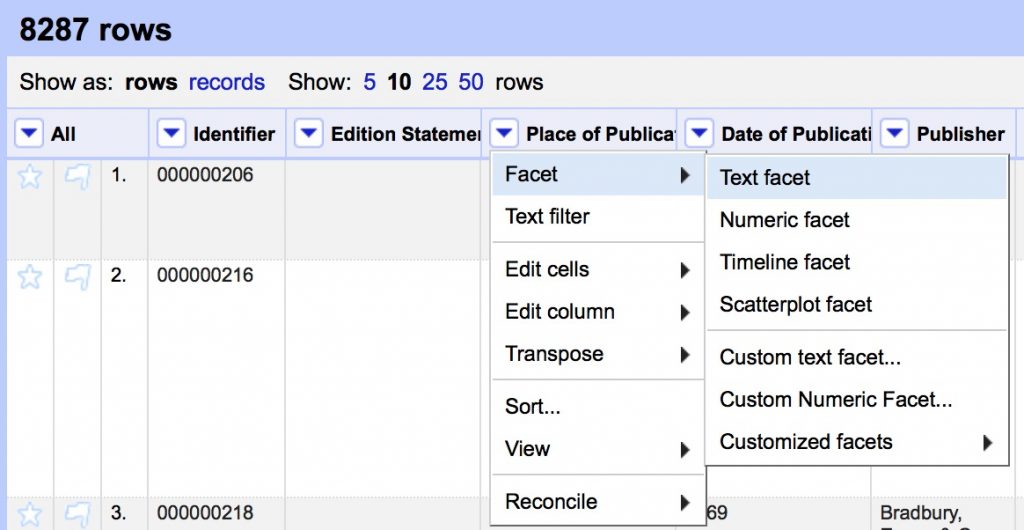
- Cluster the Place of Publication field to clean up inconsistencies
- Review the suggested clusters, choose the best New Cell Value, Merge Selected & Re-Cluster
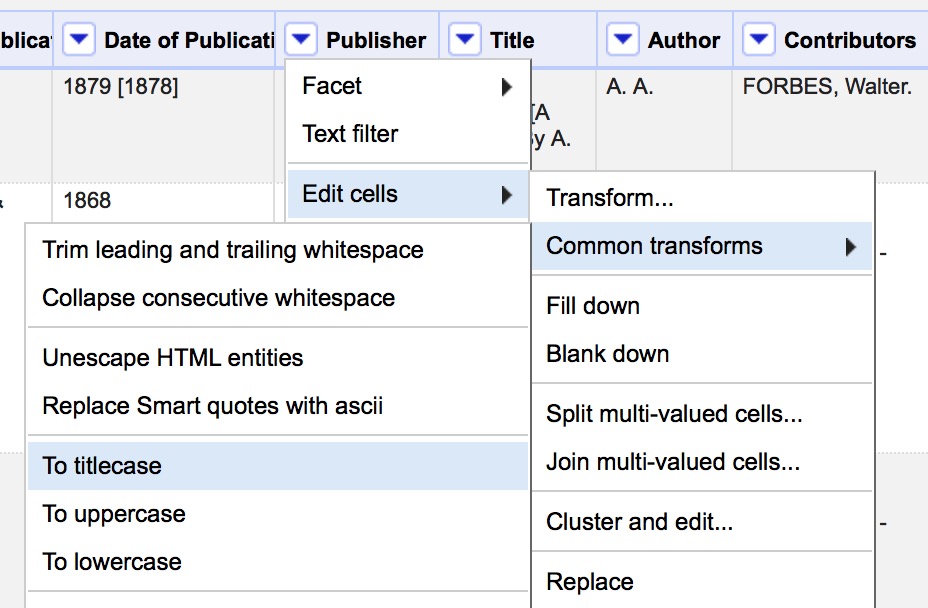
- Use Edit Cells > Common Transforms to
- Convert all values in Publisher field to Title Case
- Remove leading and trailing white space
- Clean up the Date of Publication column so that we can create a timeline. We will do this using custom text transforms and regular expressions (see below).
- Create a text facet on Date of Publication
(we can’t use a numeric or timeline facet because of all the non number characters in this column “[]?” etc.) - Select All, Merge Selected & Recluster
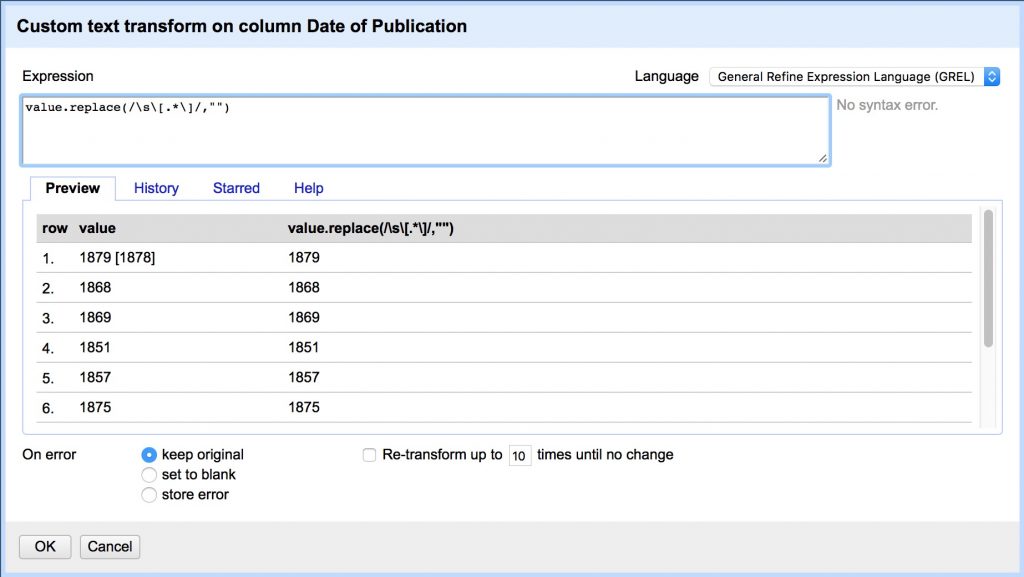
- Now we need to clean up non-date characters by copy/pasting the following regex expression in the Edit Cells > Transform box
- Remove all secondary dates in brackets that follow the first
value.replace(/\s\[.*\]/,"")
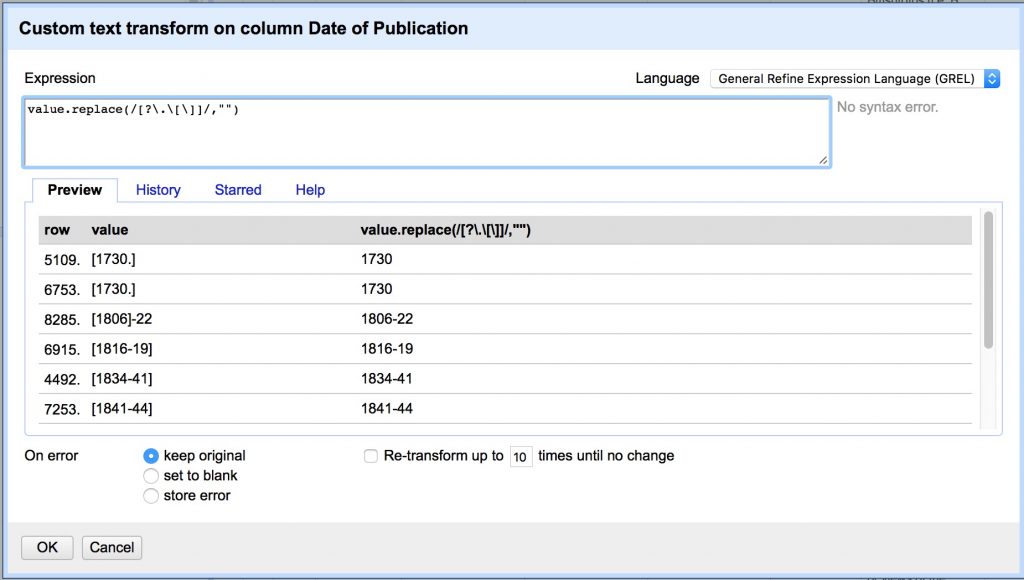
- Remove [].? characters.
(Note we have to escape .[] with backslashes because they have special meaning in regex)
value.replace(/[?\.\[\]]/,"")
- Capture groups. Putting parentheses “()” around a pattern “captures” it and allows you to recall the captured group later. This regex captures three groups and replaces the current value with only the Group 2, referred to in GREL by “$2”.
- Group 1: any non-digit characters at the beginning (the * is a quantifier that matches 0 or more of the preceding character)
- Group 2: the first 4 digit date,
- Group 3: any additional characters after that date, up to the end of the line, signified by “$”
value.replace(/(\D*)(\d{4})(.*$)/,"$2")
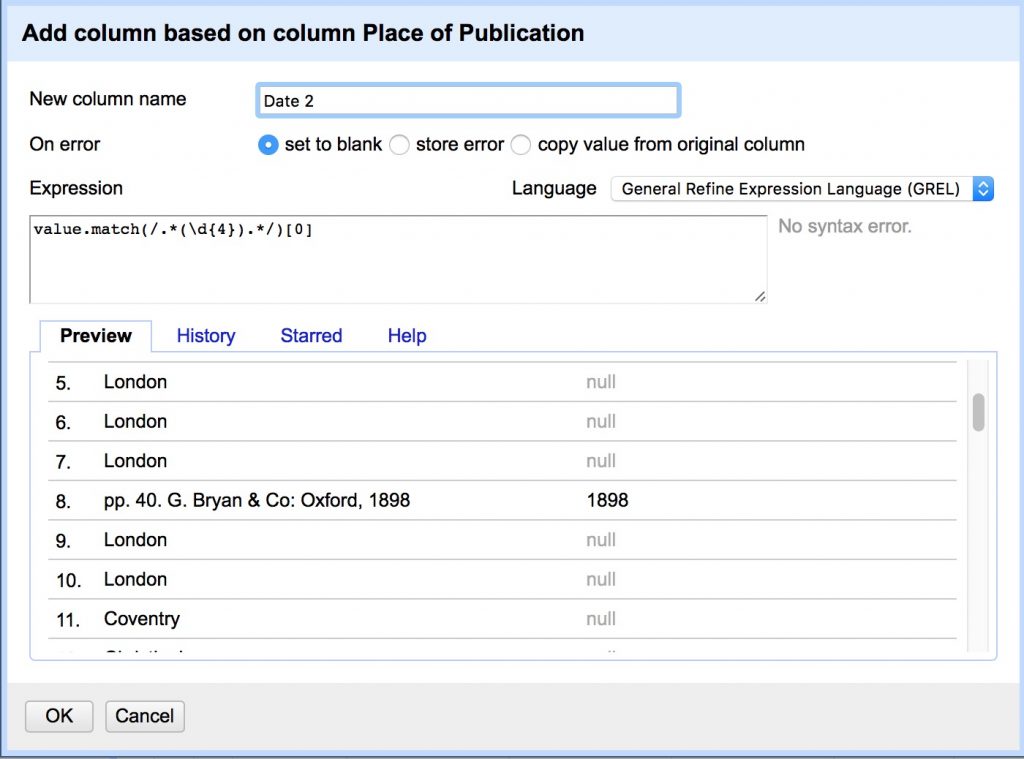
- Add column “Date 2” from column “Place of Publication”:
- Some of the publication dates were not correctly split into the date column and appear after commas at the end of Place of Publication values.
- This regex matches 0 or more characters at the beginning, captures four digit dates, and returns the first captured group, referred to here by its index [0]
value.match(/.*(\d{4}).*/)[0]
- Merge 2 date columns back into one
- Select all blank Date of Publication cells in the text facet by clicking on (blank)
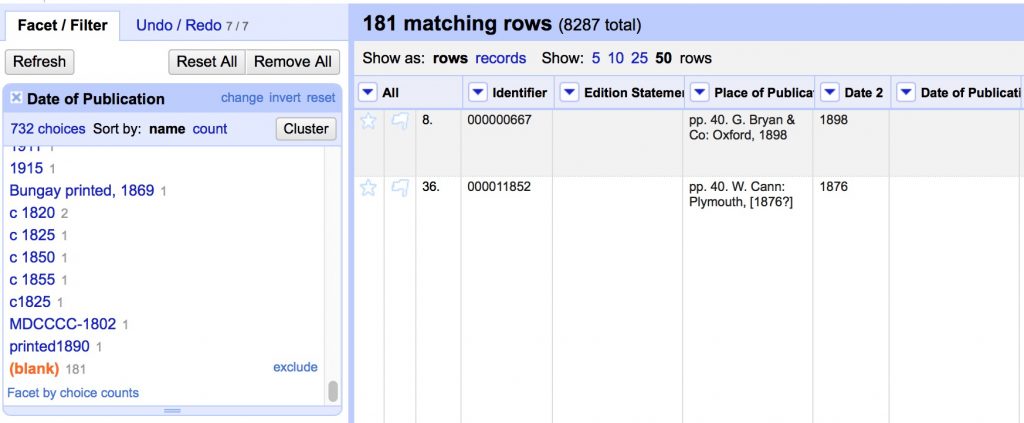
- Transform cells in Date of Publication to move new values into original column
cells["Date 2"].value
- Remove “Date 2” column
- Edit column > Remove this column
- Edit column > Remove this column
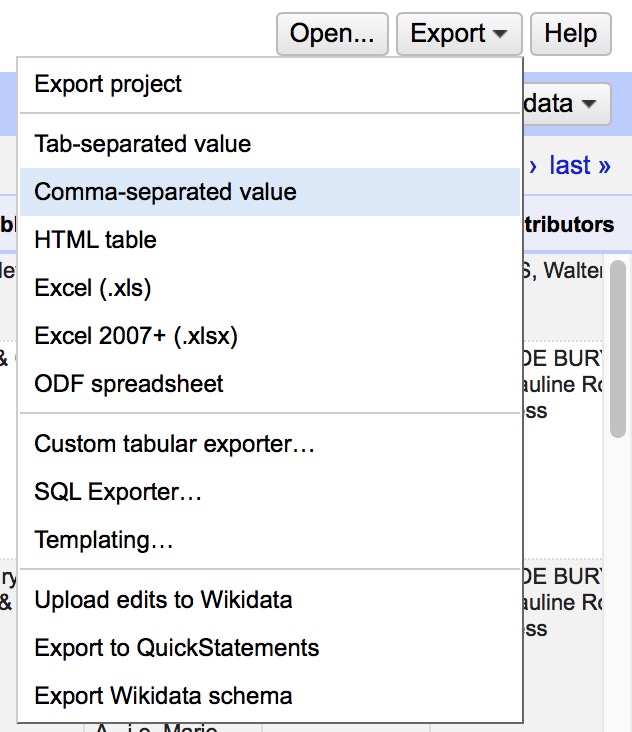
- Export CSV and you’re done!
Regular Expressions
Regular Expressions are a fantastically useful tool to match patterns in text to do advanced find, replace, and extract operations. They are implemented slightly differently in many different applications, but here are some general resources to get you started.
- RegExr is a great browser based tool to learn and try out regular expressions, much like paste bin sites like jsBin or CodePen that we’ve used for HTML, CSS and JavaScript
- Understanding Regular Expressions lesson from the Programming Historian
- A great introduction to the power of regex using advanced find and replace in LibreOffice
- Cleaning OCR’d text with Regular Expressions lesson from the Programming Historian
- A next level up in regex use, writing a python script to parse messy OCR’d data
- Regular Expressions cheat sheet from the TextMate text editor
- A handy go to guide for the most commonly used regular expressions
Visualization Project: Timeline
Now that we’ve cleaned up the “Date of Publication” field from the list of book images from the British Library, we can create an interactive timeline visualization with it.
One of the longest-running types of applications is an interactive timeline. We will do a class project to convert our flat spreadsheet into an interactive timeline using an easy to use application, but there are other tools that require more coding and show you how these work. Take a look at the SIMILE timeline tool for an example of one of those.
Export from OpenRefine
First, go back to OpenRefine project.
We are going to make a timeline of the books published between 1700 and 1800.
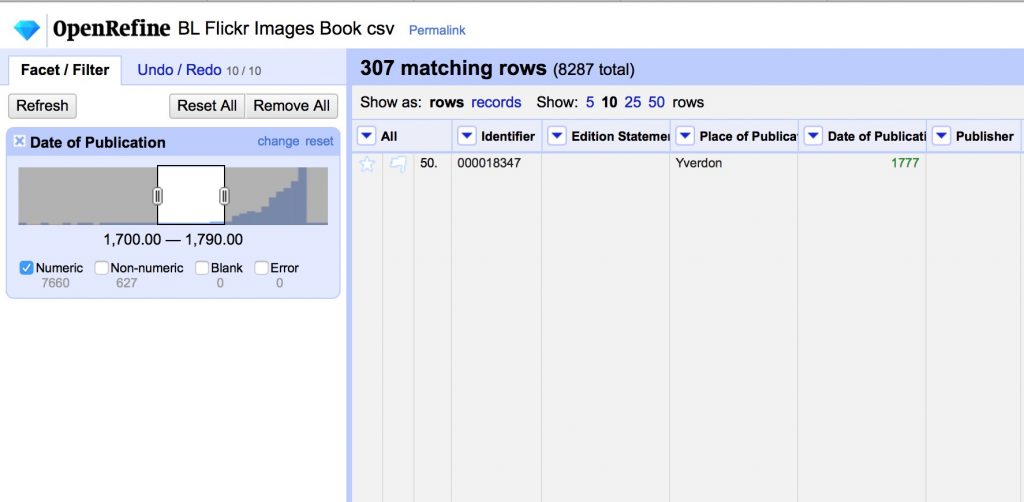
- Use Edit Cells > Common Transforms > to number on the Date of Publication field
- Use the number facet on the Date of Publication column to select a range, and uncheck Non-numeric.
- We will split up the 307 records 1700-1790 into 30 groups of 10 each and each export a range as a csv.
Matching Data to Framework
One of the biggest challenges of using off the shelf platforms is figuring out how to map your own data onto the framework the app developers have set up. We will collectively figure out which data we will put where in the TimelineJS template.
- Go to the TimelineJS page and look over the 4 step instructions to Make a New Timeline
- I’ve already done Steps 1-3.
- Access the Google Spreadsheet Template copy here
- Once you are setup, delete the template data and move over your personal date range from the BL Flickr images data set. The dates and captions should come over with an easy copy/paste, but then you’ll probably need to finesse the rest of the data a bit.
- You might need to change the number format of the Date columns to a different date display or even Number > Plain Text to get them to display and order properly
- All entries should have a brief headline that summarizes the text on that date’s card, which you’ll need to write
- Where there are images linked, you might need to finesse the site to get them to work.
- Where there are no images, see if you can insert a Google Map if appropriate.
- NB: All Media should have a Media Credit, which will usually be “British Library“
- Finally, explore what happens to the timeline when you use tags to categorize events.
If you’re in doubt or stuck, post a comment to ask a question and we’ll try to help each other out.
OpenRefine Resources
There are a lot of great resources for getting started out there, but here are a few to get you started.
- Miriam Posner’s introduction to OpenRefine
- A basic introduction to the tool, that will give you the key features for working from messy data that is already in a table
- Cleaning data with OpenRefine lesson from the Programming Historian
- A more in-depth exploration including using the GREL language to do more advanced programmatic cleaning
- Fetch and Parse data with OpenRefine lesson from the Programming Historian
- A power application that uses GREL to fetch URLs and parse web content into csv files