Sophie’s Midterm: King Lear
Here is a link to my midterm! I analyzed King Lear using Voyant Tools.
Here is a link to my midterm! I analyzed King Lear using Voyant Tools.

This project is a 3D model of the historic Northfield Train Depot.
Here is the link to my midterm project site! I created a map to show information about the Tate Collection’s artists.
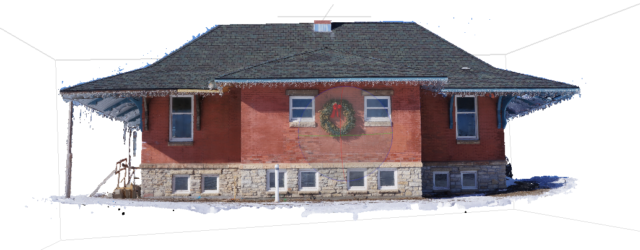
This is the link to my project website!!! I used the photos provided of the Northfield Depot and Agisoft software to create a 3D model.
It is at this point I’m realizing that I probably didn’t do this project quite right. There isn’t a whole lot I can do about that now, so here’s the link to my site’s subdomain. My project looks at both… Continue Reading
For my project, I analyzed Shakespeare’s Midsummer Night’s Dream by looking at the frequency of “positive” and “negative” words throughout the text using Voyant Tools. Here is the link to my project site!
I chose to perform data visualization on the Tate Museum artist data set, which you can find here. I looked at the diversity in geographic origin of the artists, as well as the gender ratio.
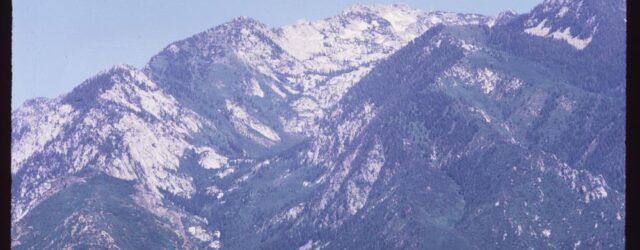
For my midterm, I used ArcGIS Online to map Charles W. Cushman’s photos from 1966 and explore how the environment influenced Cushman’s photography. You can find my project here and navigate to the “About” page to read my methods.
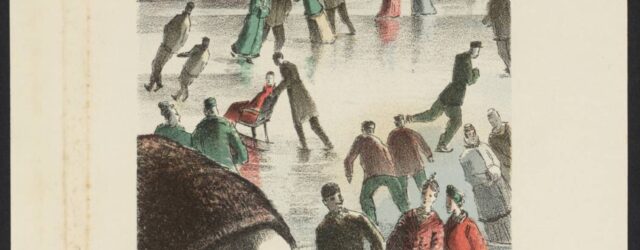
My midterm project is a visual exhibit of some of Barnett Freedman’s artwork using Omeka that analyzes his depictions of two contrasting states: solitude and togetherness. My midterm site can be found here.

This is my midterm project. In this project, I aim to analyze the architecture of a lesser-known campus building, the Music and Drama Center (or Concert Hall). Find out more below! Link: https://midterm.milliganp.sites.carleton.edu/uncategorized/midterm-analyzing-the-music-and-drama-center-building/