• Acknowledgements
  • Resources
Hacking the Humanities 2021
DGAH 110, Carleton College, Winter 2021
Menu Close
  • Home
  • Syllabus
  • Schedule
  • Labs
  • Blog
  • Tutorials
  • Midterms
  • Final Projects

Week 4: Spatial Humanities

Data Visualization: (Defunct) Google Motion Charts

March 9, 2021Wyen Leave a Comment

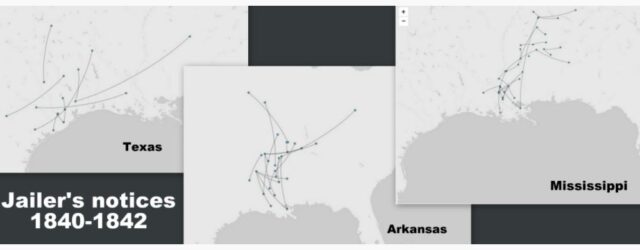
(Defunct) Google Motion Charts My first thought (aside from being amazed) when seeing Gapminder in action was that this application allows for data to be visualized so much more efficiently and concisely! By utilizing the “fourth dimension” of time through… Continue Reading →

Week 4: Spatial Humanities 4D data, Data visualization

Plausible Runaway Paths

February 2, 2021Constance Leave a Comment
Jailer's Notices

Students and scholars at Rice University created a site that showcased a few digital history methods that used a sample data set of nineteenth-century runaway slave ads. Below is one of their data visualization with Mapping Points: Using Palladio and… Continue Reading →

Week 4: Spatial Humanities

Six Degrees of Francis Bacon: The Graph Theoretic Properties of Social Networks

February 1, 2021Dominic 2 Comments

It’s an all too familiar story: “Oh! You know Bobby? My cousin’s friend’s sister’s niece’s roommate’s brother is on the same baseball team as him!” Academics are guilty of this too, Mathematicians like to quantify their Erdős Number as a… Continue Reading →

Week 4: Spatial Humanities

Assignment: Network Analysis Exploration

January 29, 2021Henrie F 2 Comments
Individual connections in Paul Revere map

In Using Metadata to Find Paul Revere, Kieran Healy gives a very clear and insightful look into networks and the ways they can be used to glean important information. Healy shows that the same network data can be used in… Continue Reading →

Assignments, Week 4: Spatial Humanities network analysis

Assignment: Data Visualization Dos and Don’ts

January 26, 2021Henrie F 2 Comments
Charles Minard's map of Napoleon's Russian Campaign

This map, created by Charles Minard to represent Napolean’s Russian Campaign of 1812, is a great example how thinking outside of the standard, prescribed-chart box can relate lots of complex data in a simple visual. Perhaps the most striking feature,… Continue Reading →

Assignments, Week 4: Spatial Humanities Charles Minard, Data visualization, Napoleon
  • Popular
  • Latest
  • Tags
  • Midterm Project Update

    11 Comments
  • Progress – Carleton’s Traditions over the Decades

    11 Comments
  • Final Project Proposal: Carleton’s Traditions over the Decades.

    11 Comments
  • Our Final Project!

    8 Comments
  • Tutorial – Conditional Formatting in Excel

    7 Comments
  • Tutorial: Timeline JS

    March 15, 2021
  • Historical 3D Model-3D Bank

    March 15, 2021
  • Tutorial: Using TimeMapper!

    March 15, 2021
  • Lab 2.2 Coding HTML and JavaScript

    March 14, 2021
  • Lab 1.2 Why DH

    March 14, 2021
tutorial Digital Humanities midterm Sketchup SketchUP3D Coding Data visualization WDTCFWDTG Analyzing Digital Humanities Projects Assignment network analysis Network Analysis Exploration 3D Bank 3D Modeling Reverse Engineering Digital Humanities and Programming carleton-traditions Tutorial Assignment Blog 3-d modelling Data mining pro-coding web development fundamentals DH Projects DH_Projects DH Project Carleton Web Analysis Mascot Computer Science 4D data

License

This work is licensed under a Creative Commons Attribution-NonCommercial 4.0 International License. Creative Commons License
If you use these materials in your class, please let me know.

Meta

  • Log in
  • Entries feed
  • Comments feed
  • WordPress.org
© 2026 Hacking the Humanities 2021. All rights reserved.
Fashionista by aThemes
css.php